The WR Radar Chart
The stats that help tell the story of a receiver
Hi again! I did this explanation for QBs, and I will do it again for every position on the field when I evaluate them. So today, we start our journey into WR prospects. If you want to see the evaluations, subscribe so they get sent directly to you when I send them out!
Thanks for reading Duncan Drafts! Subscribe for free to receive new posts and support my work.
What is a radar chart?
A radar chart is a way to quickly and effectively present information, especially when trying to show how a player compares across multiple statistics and their percentiles in those statistics. It has become one of the default ways of showing player stats in the other football (soccer) for how easily it conveys data, and was popularized by Ted Knutson and the team at Statsbomb.
Why use them?
Radar charts give a quick and easy look at the kind of player you are looking for. The statistics represent different archetypes at QB. Do you have a scrambling QB, a pocket passer, or a mobile QB? Does the QB play a high or low variance game?
However, there are a few things to remember when looking at these charts. All this represents is statistical output, and if you were to have players on other teams or in different situations, it would most likely affect all the numbers.
This is only a tool to help evaluate players and add extra context to a holistic evaluation.
The Stats and the Data Set
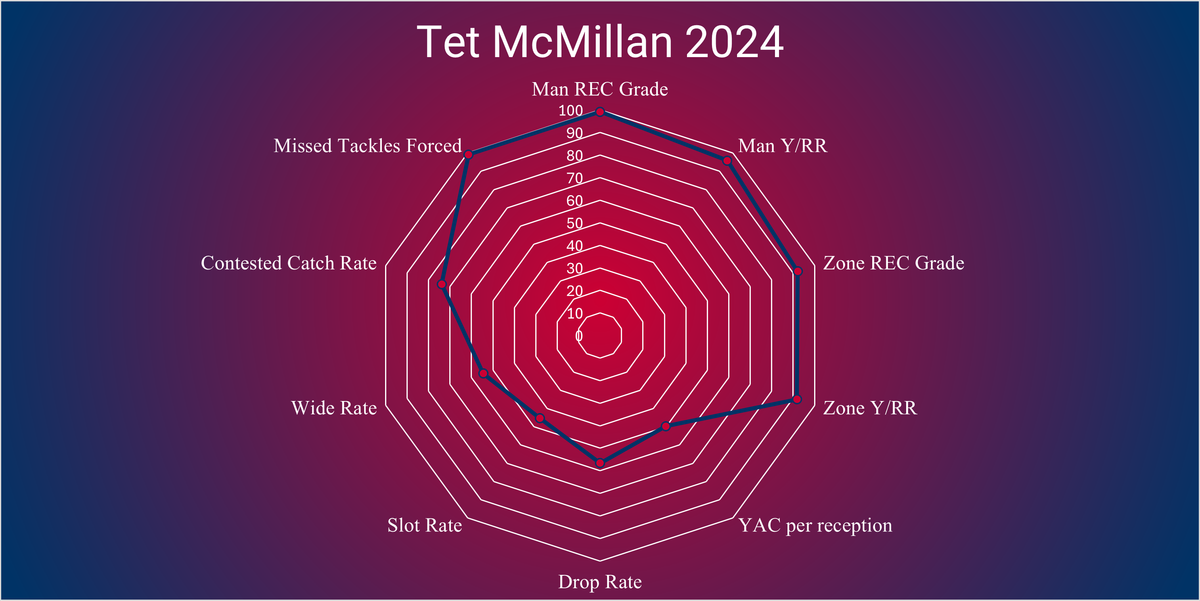
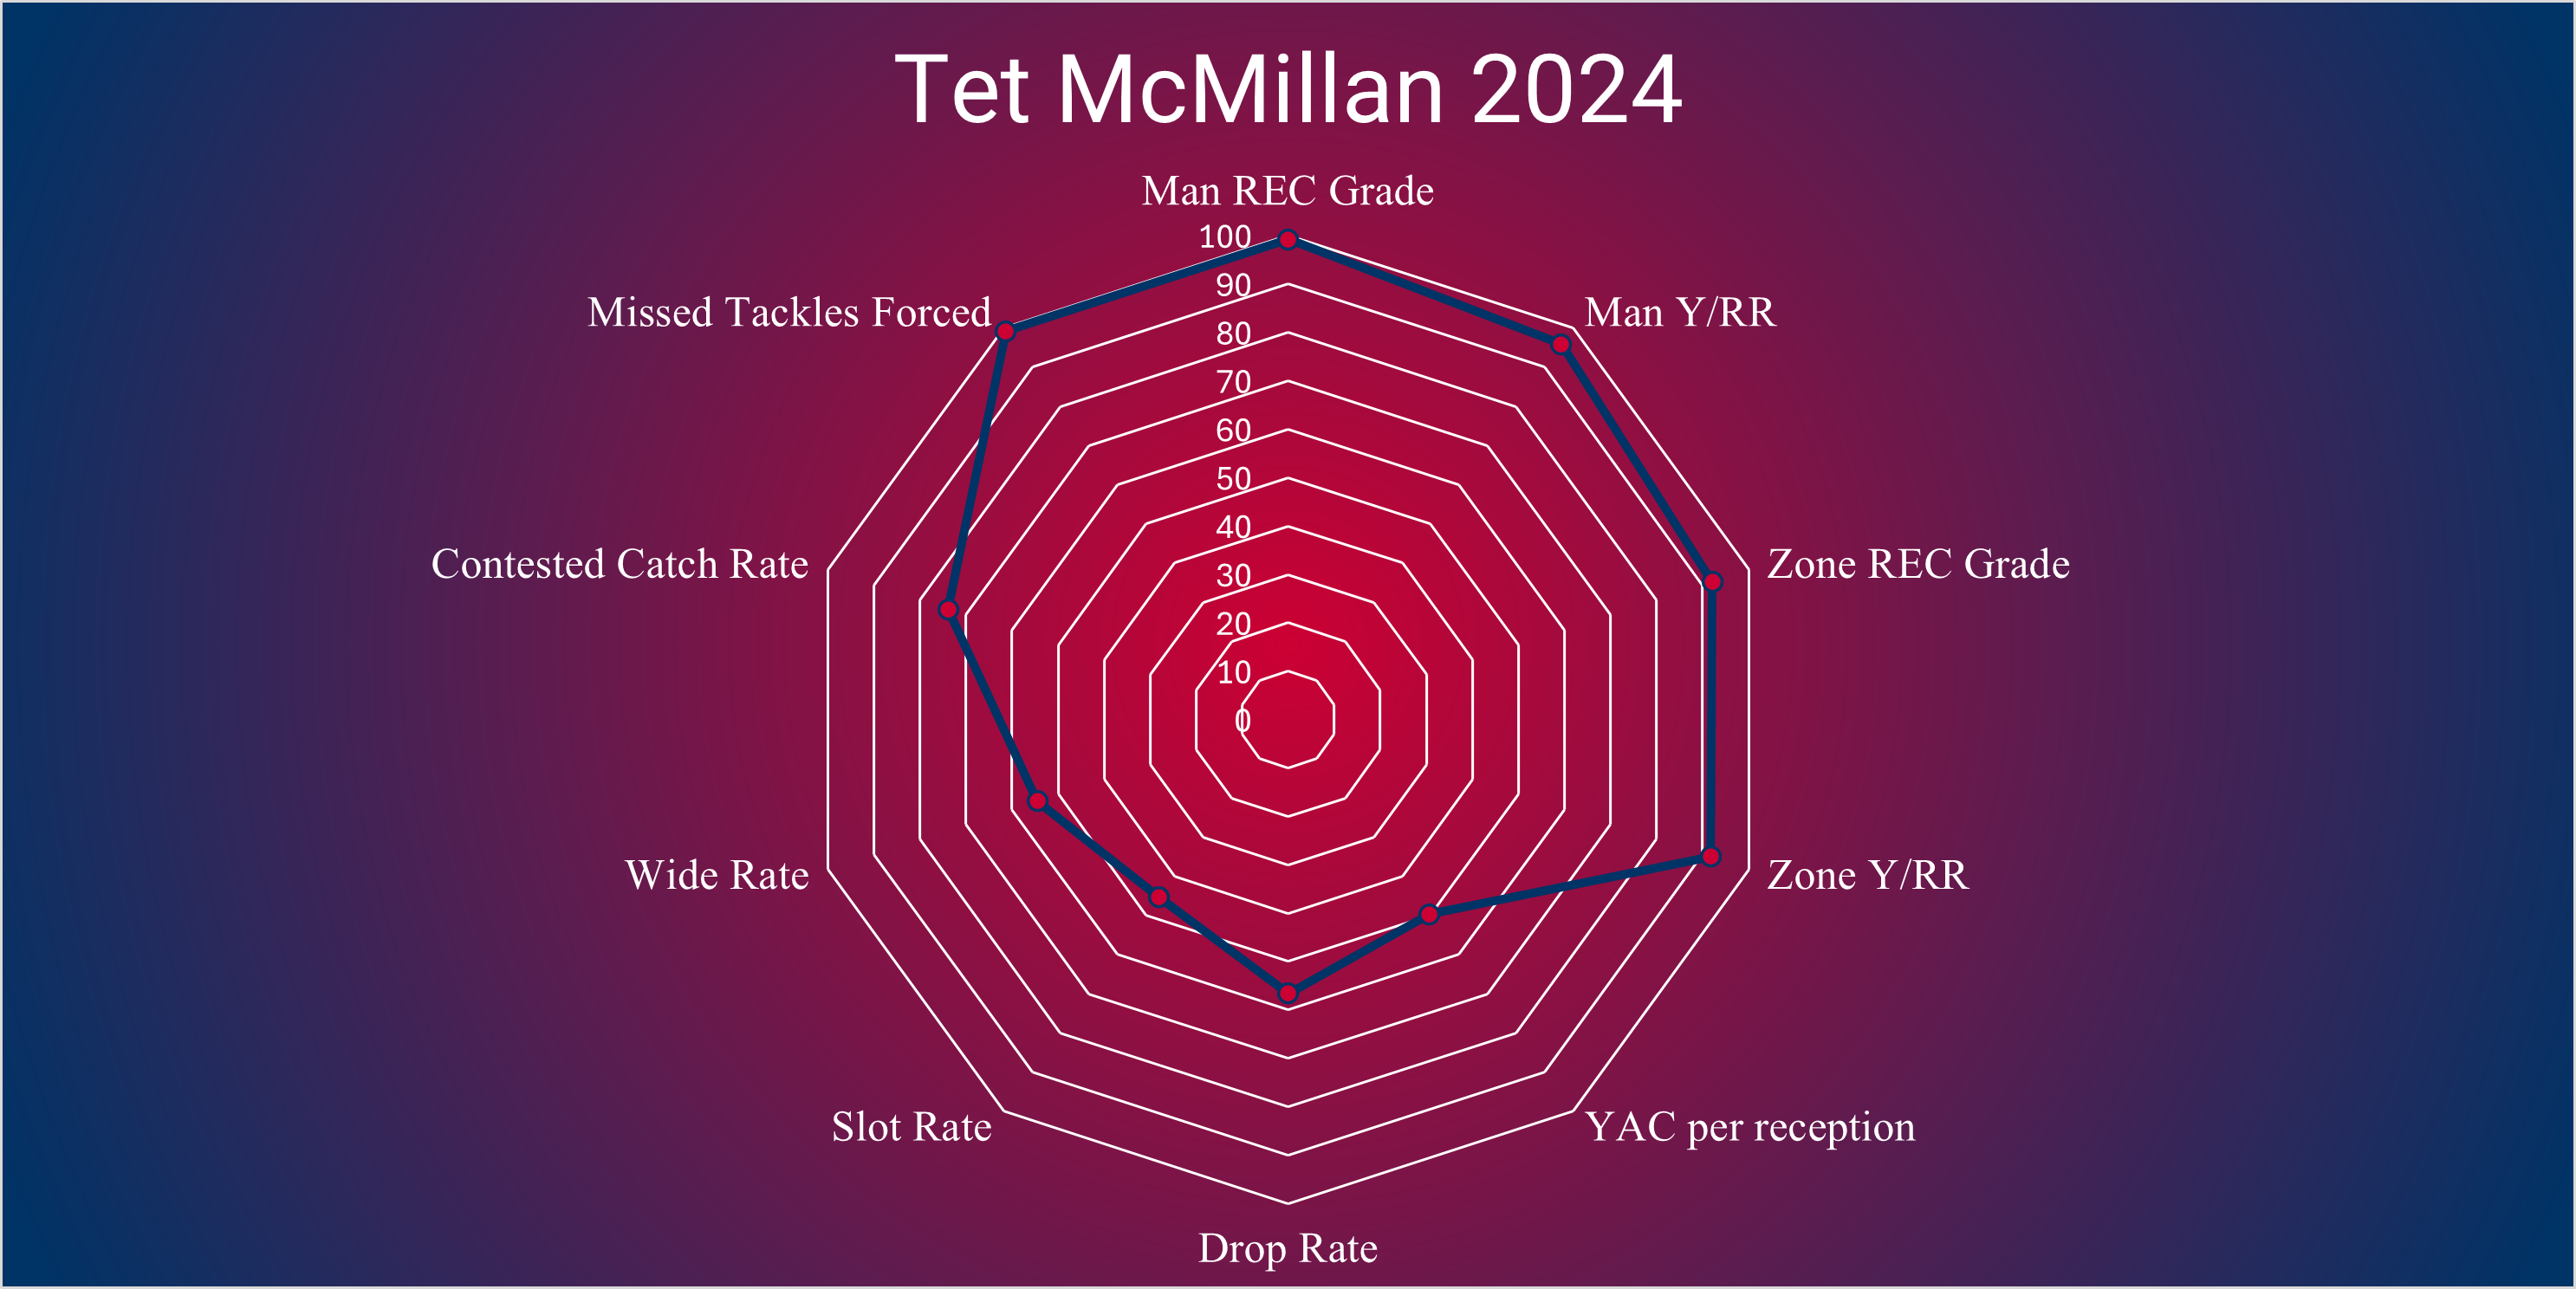
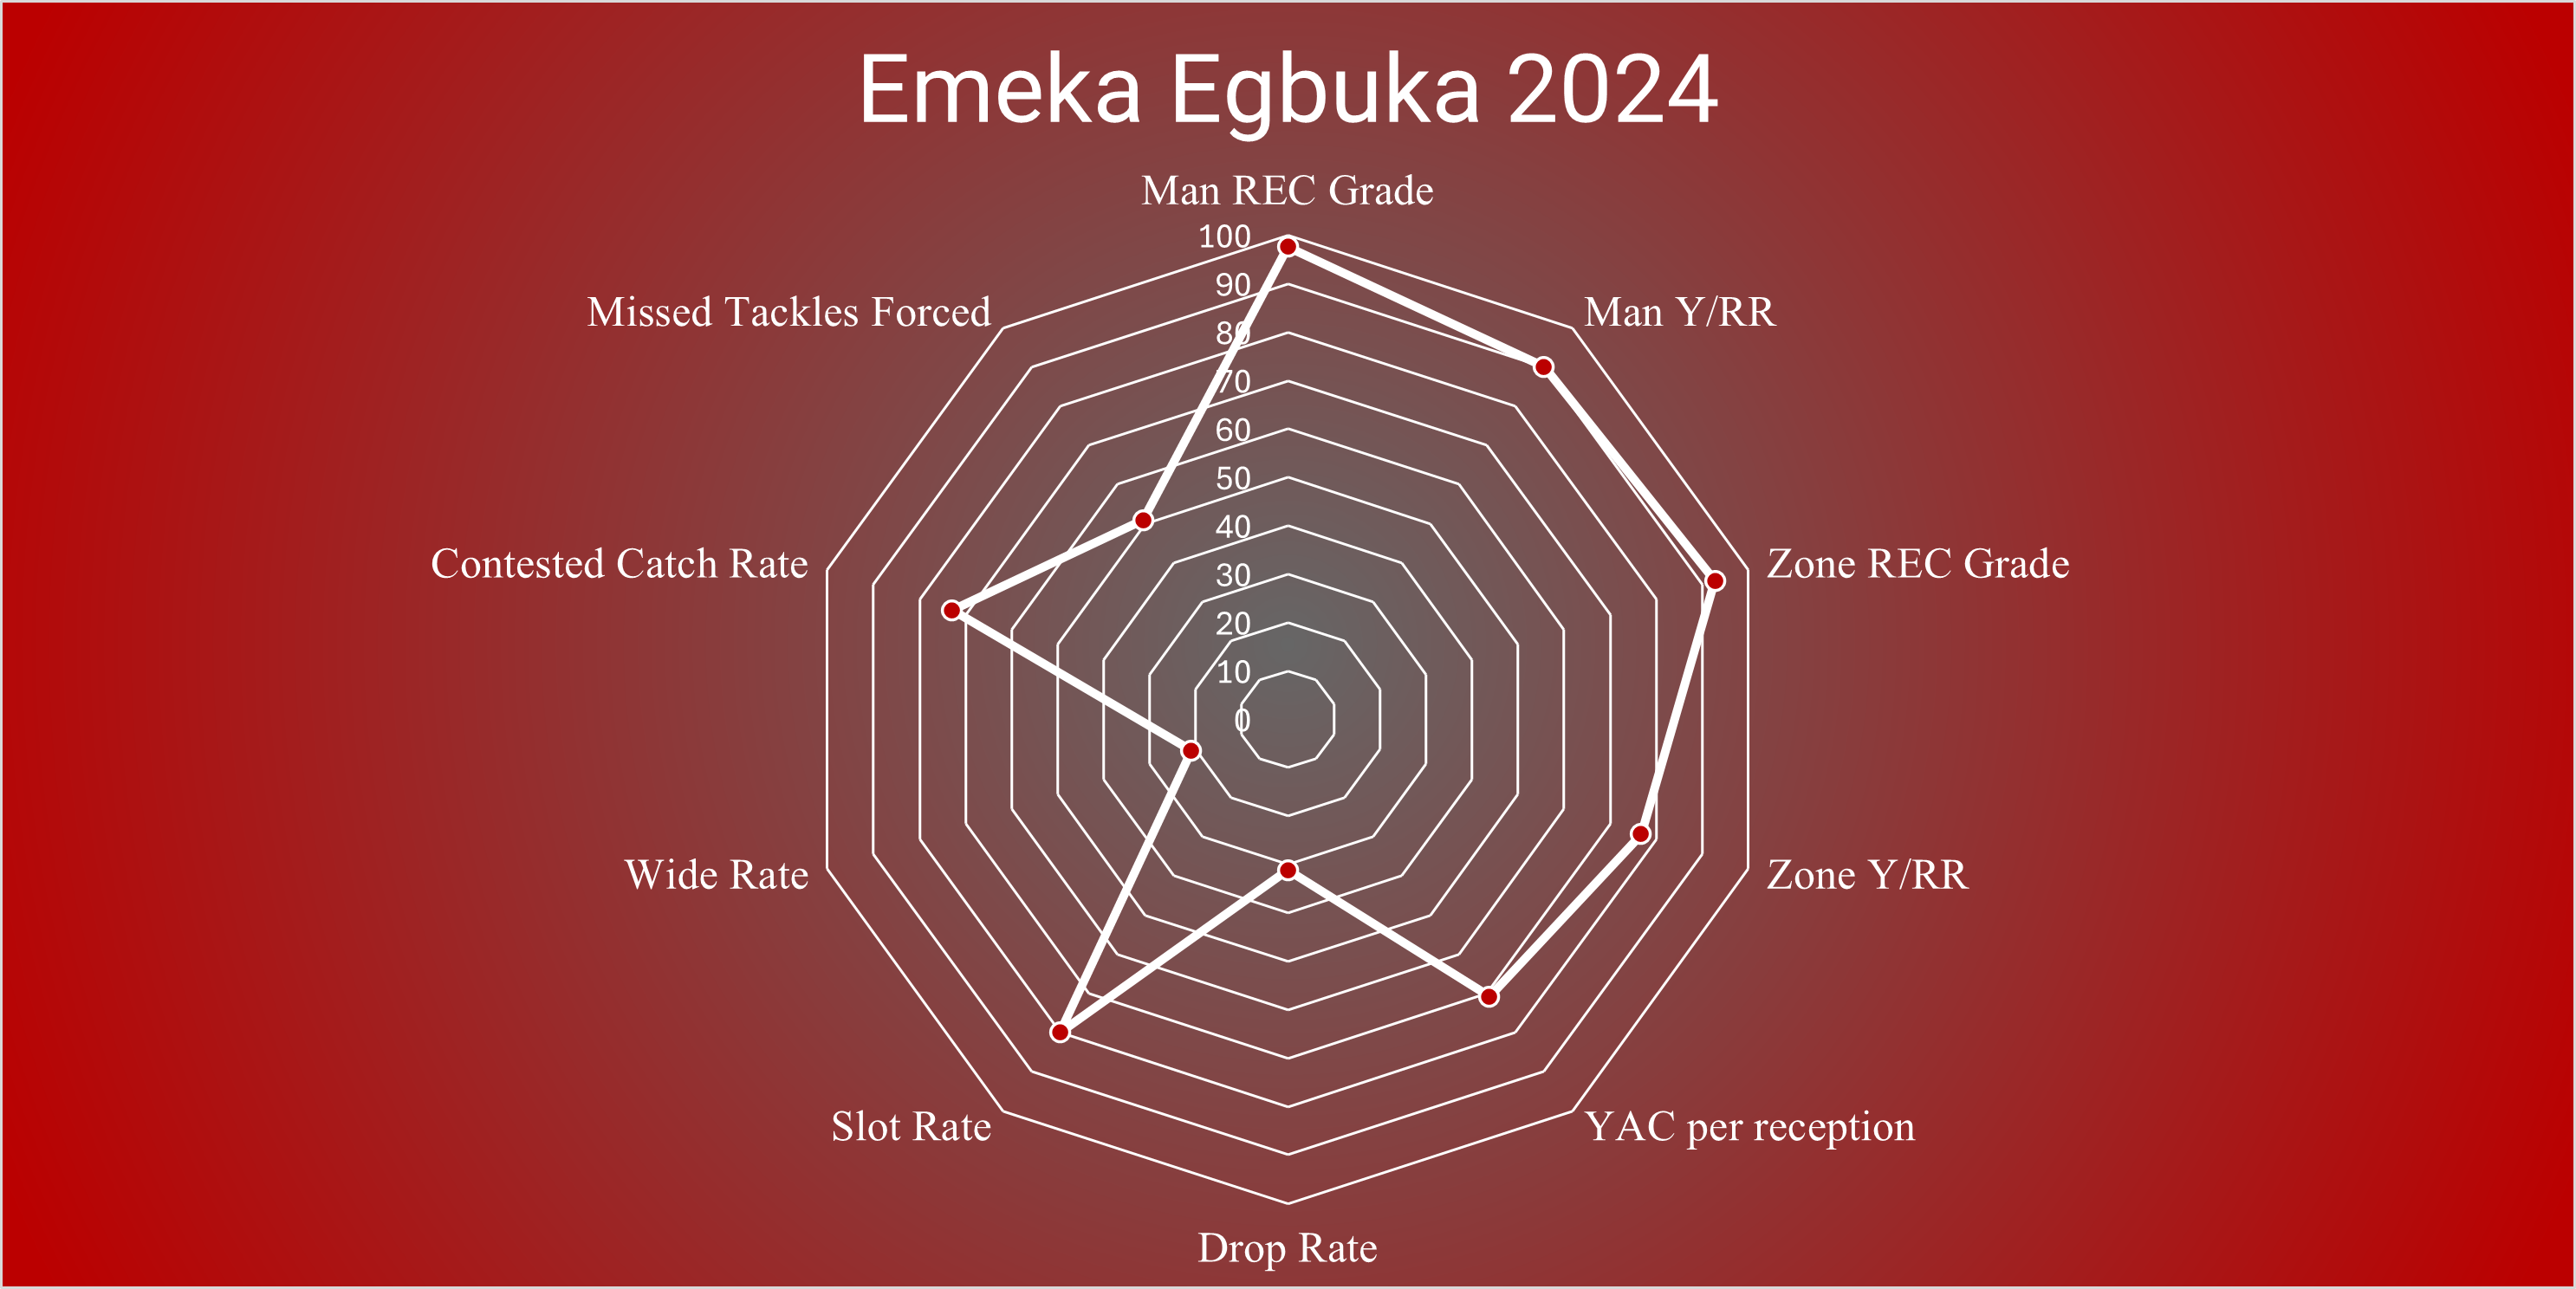
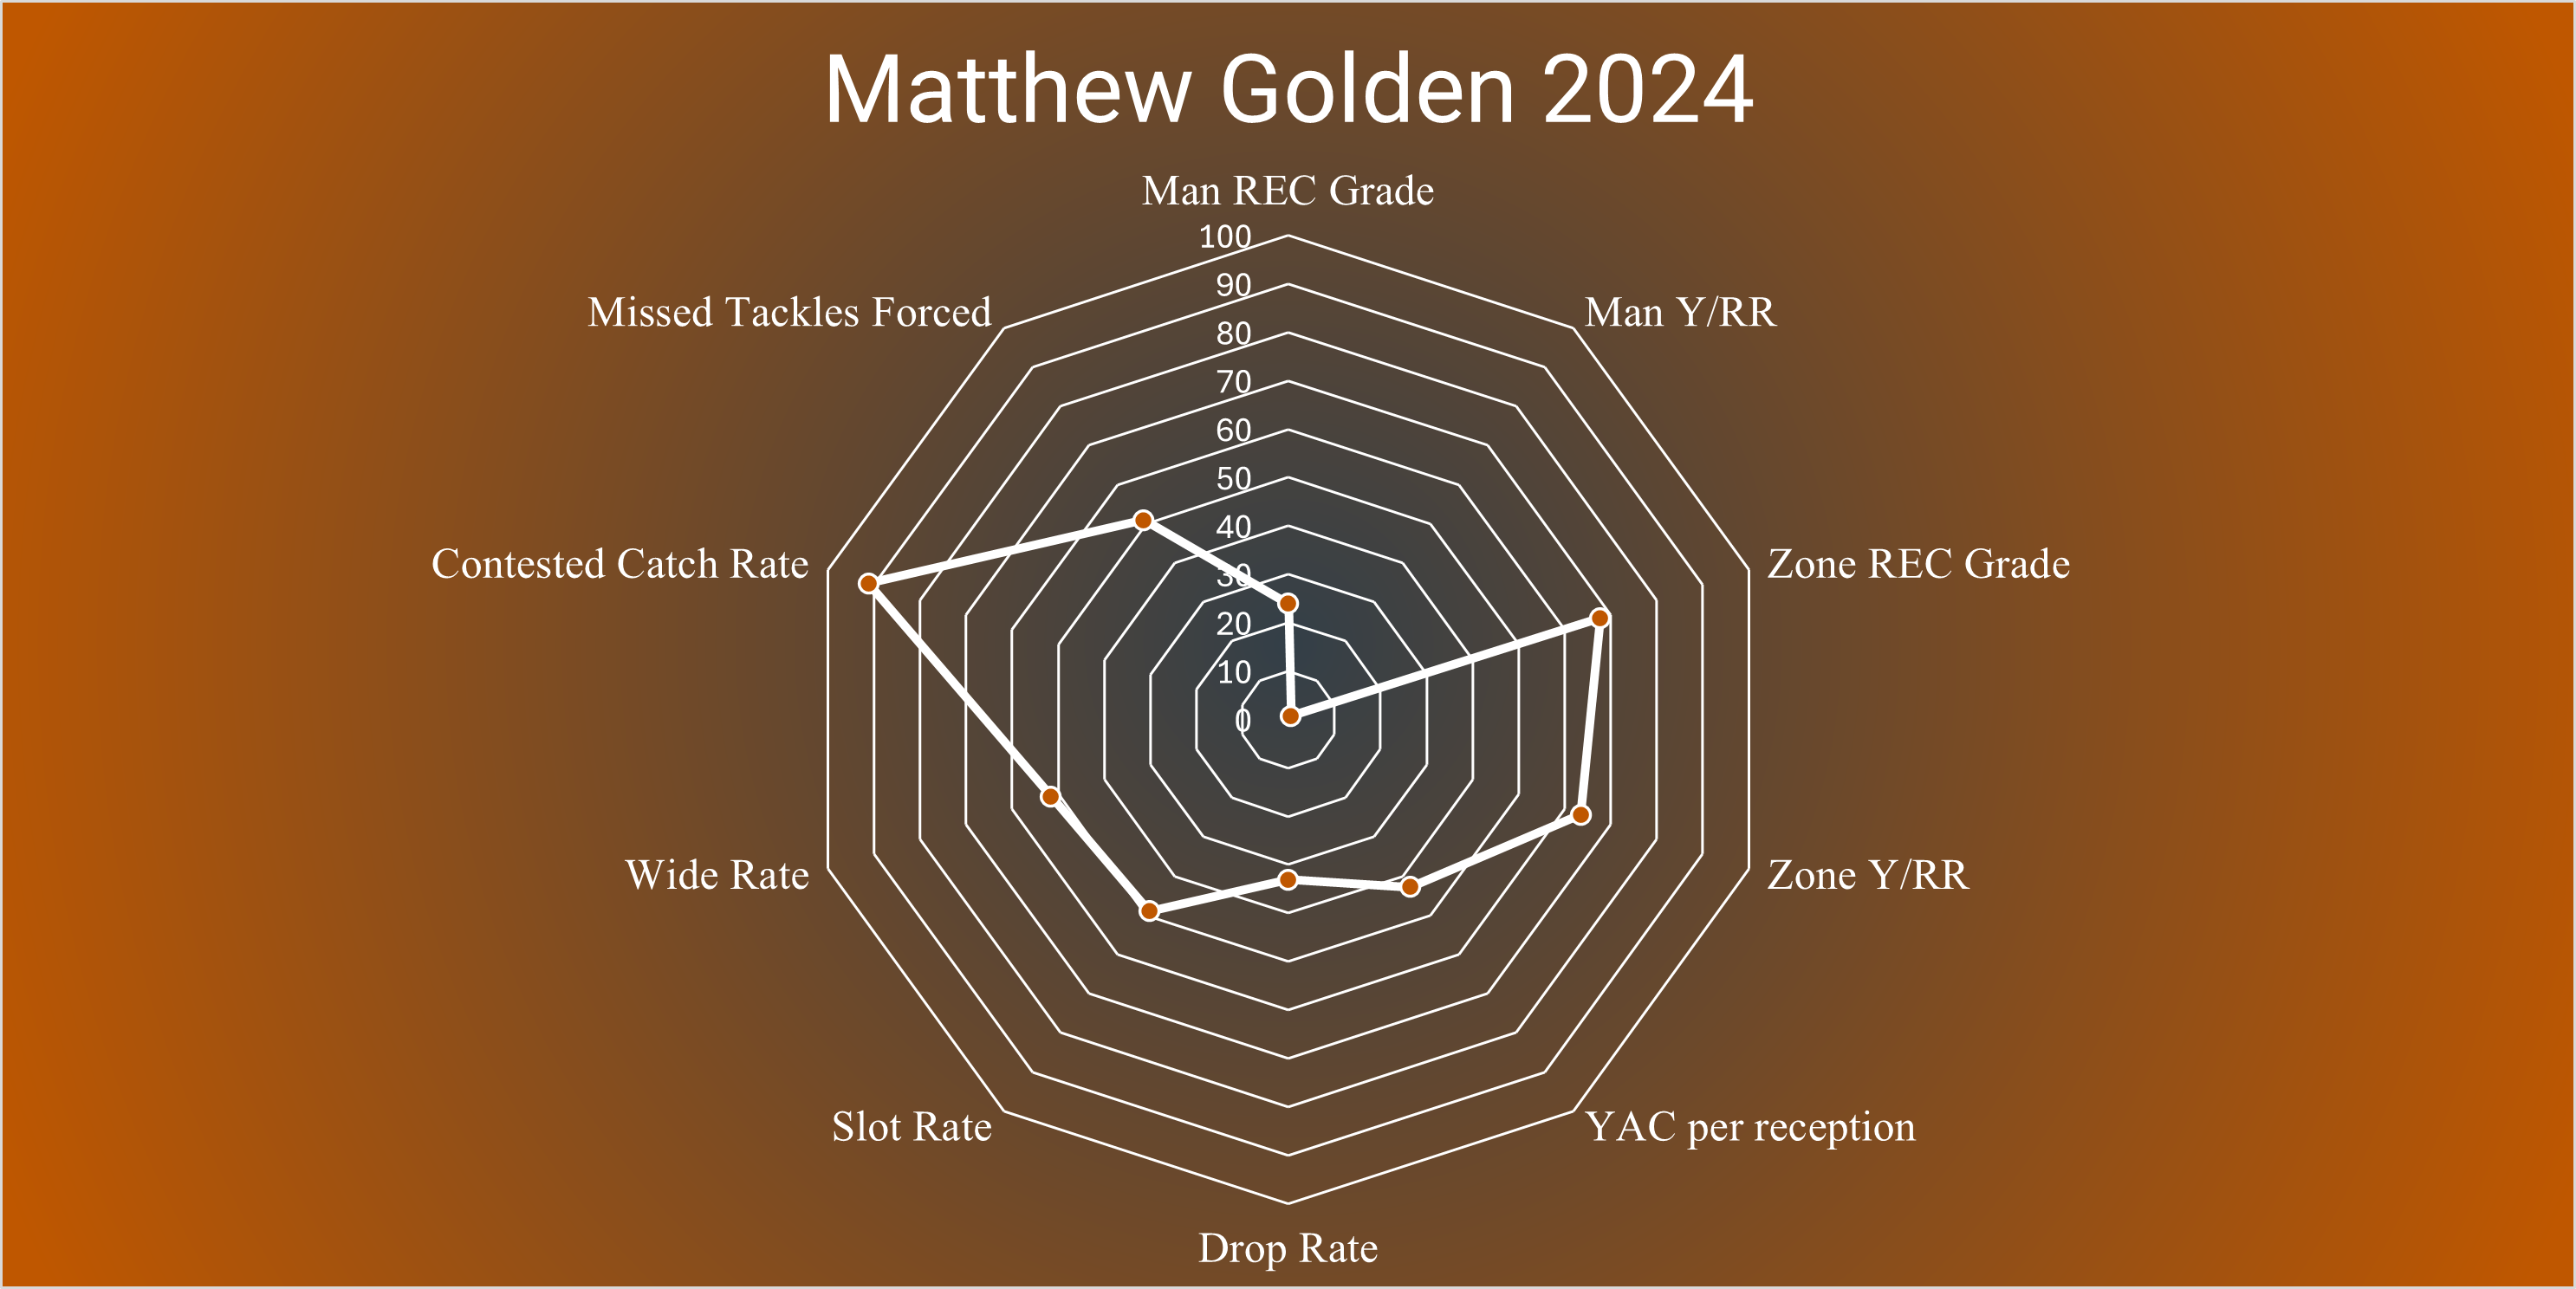
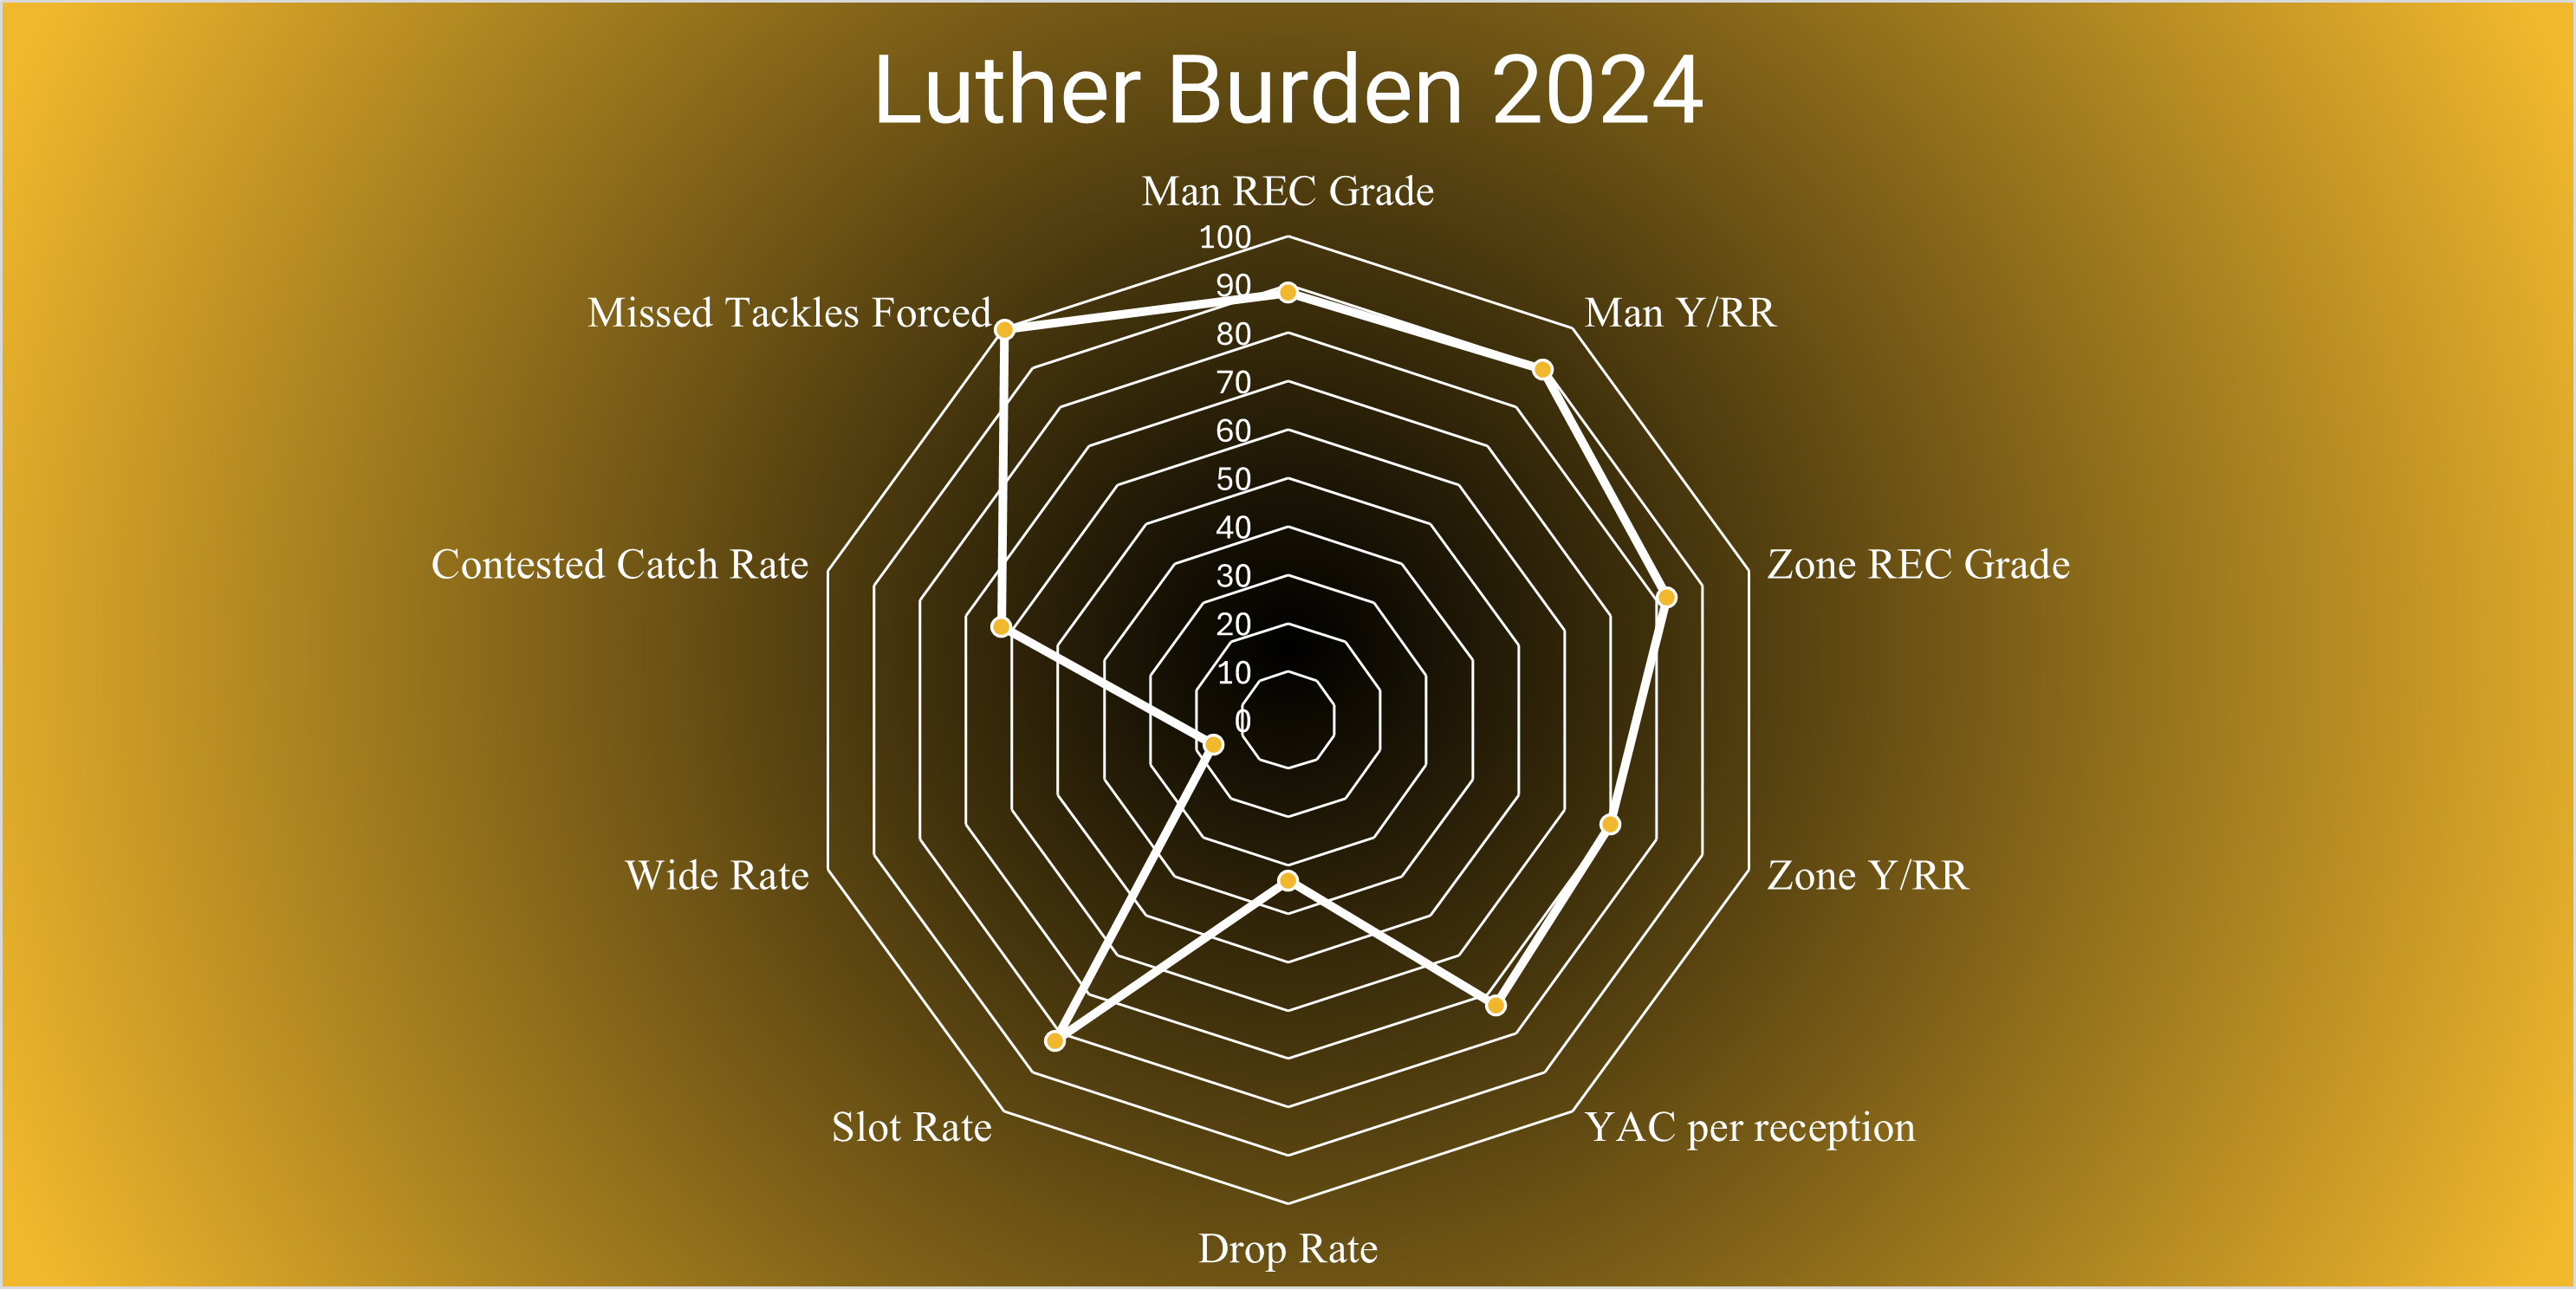
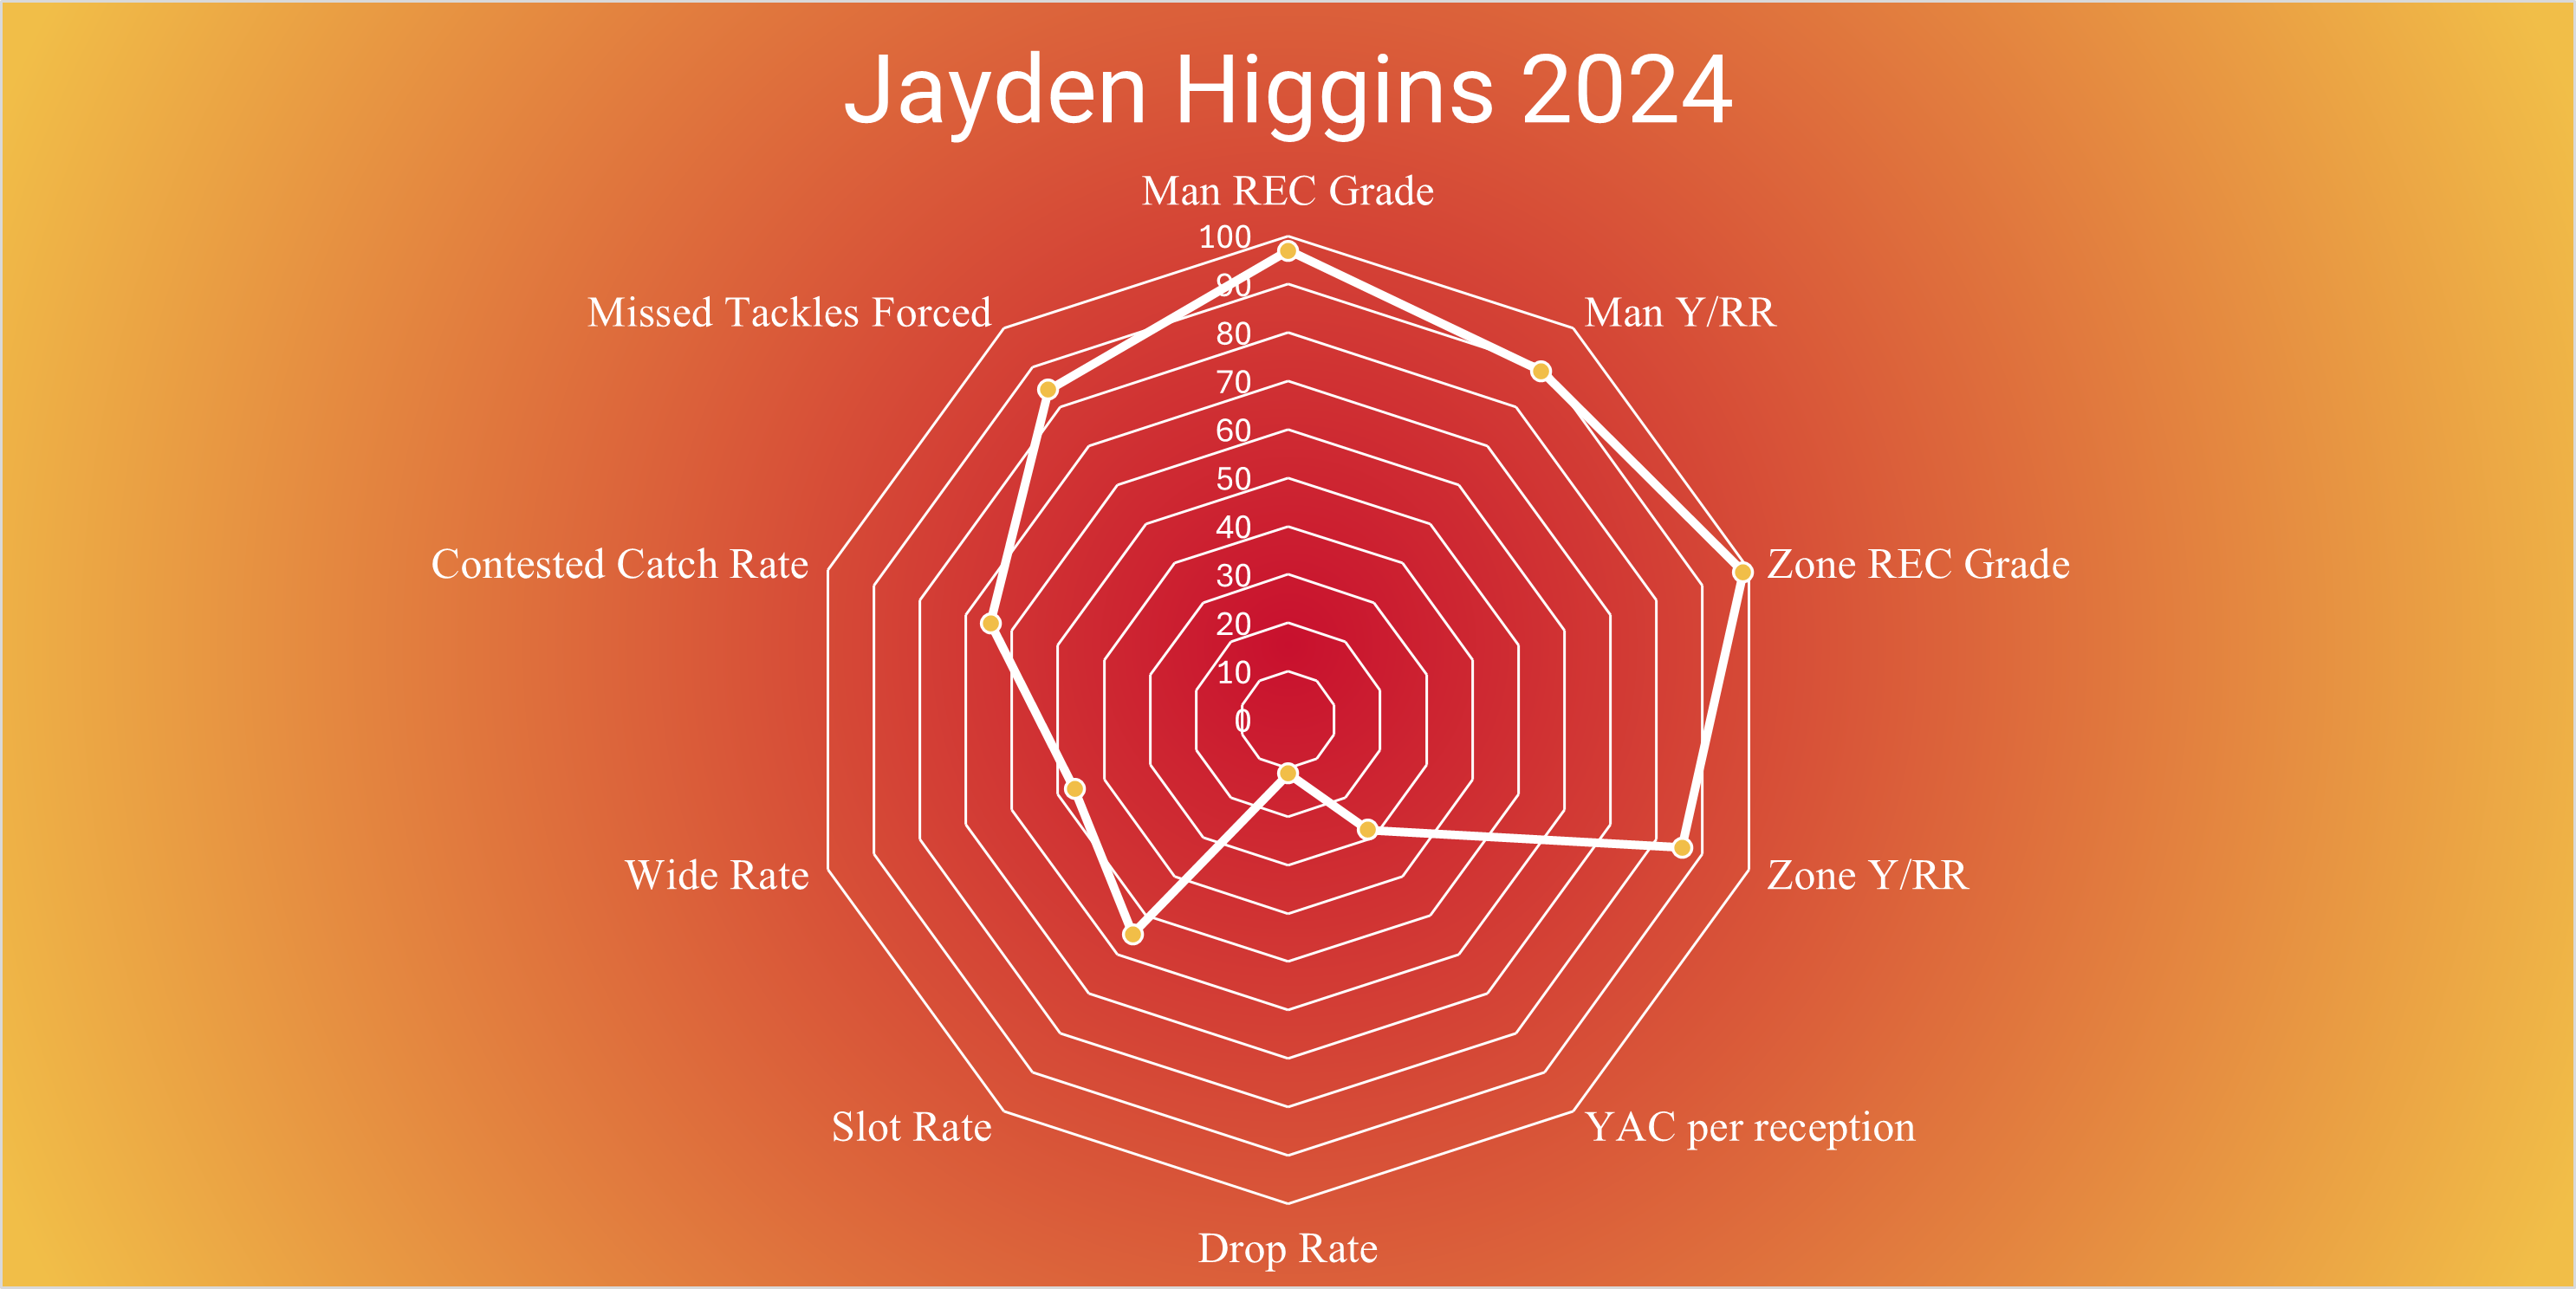
The data is all sourced from PFF and includes all WRs who played FBS football from 2018 to the present with at least 30 targets. These stats were chosen because I believe they best exemplify what type of WR a prospect is. What coverages do they do well with, are they a threat with the ball in their hands, and where do they most often line up.
Man REC Grade: PFF Grading system for eligible receivers when facing man coverage
Man Y/RR: Yards per route run when against man coverage
Zone REC Grade: PFF Grading system for eligible receivers when facing zone coverage
Zone Y/RR: Yards per route run when against zone coverage
YAC per Reception: Yards after catch average for every reception
Drop Rate: How often a player drops an on-target pass. This is the only statistic in the data set for which lower is better.
Slot Rate: The percent of time a WR lines up in the slot
Wide Rate: The percent of time a WR lines up outside
Contested Catch Rate: Rate of catches in contested situations
Missed Tackles Forced: Number of tackles either broken or made to be missed
The top 5 WRs drafted in 2025:
Look out for my first evaluation beginning this Saturday!