The DT Radar Chart
What is a radar chart?
A radar chart is a way to quickly and effectively present information, especially when showing how a player compares across multiple statistics and their percentiles in those statistics. It has become one of the default ways of showing player stats in the other football (soccer) for how easily it conveys data, and was popularized by Ted Knutson and the team at Statsbomb.
Why use them?
Radar charts give a quick and easy look at the kind of player you are looking for. The statistics represent different DT archetypes. Do you have a pure pass rusher, a big nose tackle, or an all-rounder?
However, there are a few things to remember when looking at these charts. All this represents is statistical output, and if you had players on other teams or in different situations, it would most likely affect all the numbers.
This is only a tool to help evaluate players and add extra context to a holistic evaluation.
The Stats and the Data Set
The data is all sourced from PFF and includes all DTs who played FBS football from 2015 to the present with at least 100 snaps, and compares the DT against their draft year, unless otherwise specified. These stats were chosen because I believe they best exemplify what type of DT a prospect is.
- PFF Defense Grade – A proprietary PFF rating capturing an interior defensive lineman's overall contribution across all play types.
- PFF Pass Rush Grade – A proprietary PFF rating evaluating effectiveness as an interior pass rusher.
- Pass Rush Win Rate – The percentage of individual pass rush reps where the lineman beat their blocker within 2.5 seconds of the snap.
- Total Pressures – The total number of quarterback pressures generated (sacks + hits + hurries).
- Pressure Rate % (PRP) – The percentage of pass rush snaps that result in a quarterback pressure.
- PFF Run Defense Grade – A proprietary PFF rating measuring effectiveness against the run.
- Stop Percentage – The percentage of run plays a lineman was involved in that were stopped at or behind the line of scrimmage.
- Tackles for Loss – Total tackles made behind the line of scrimmage.
- Missed Tackle Rate – The percentage of tackle attempts that were missed, as graded by PFF. Lower is better.
- A Gap Snaps / B Gap Snaps / Over Tackle Snaps – The number of snaps a lineman aligned in each zone along the interior of the line.
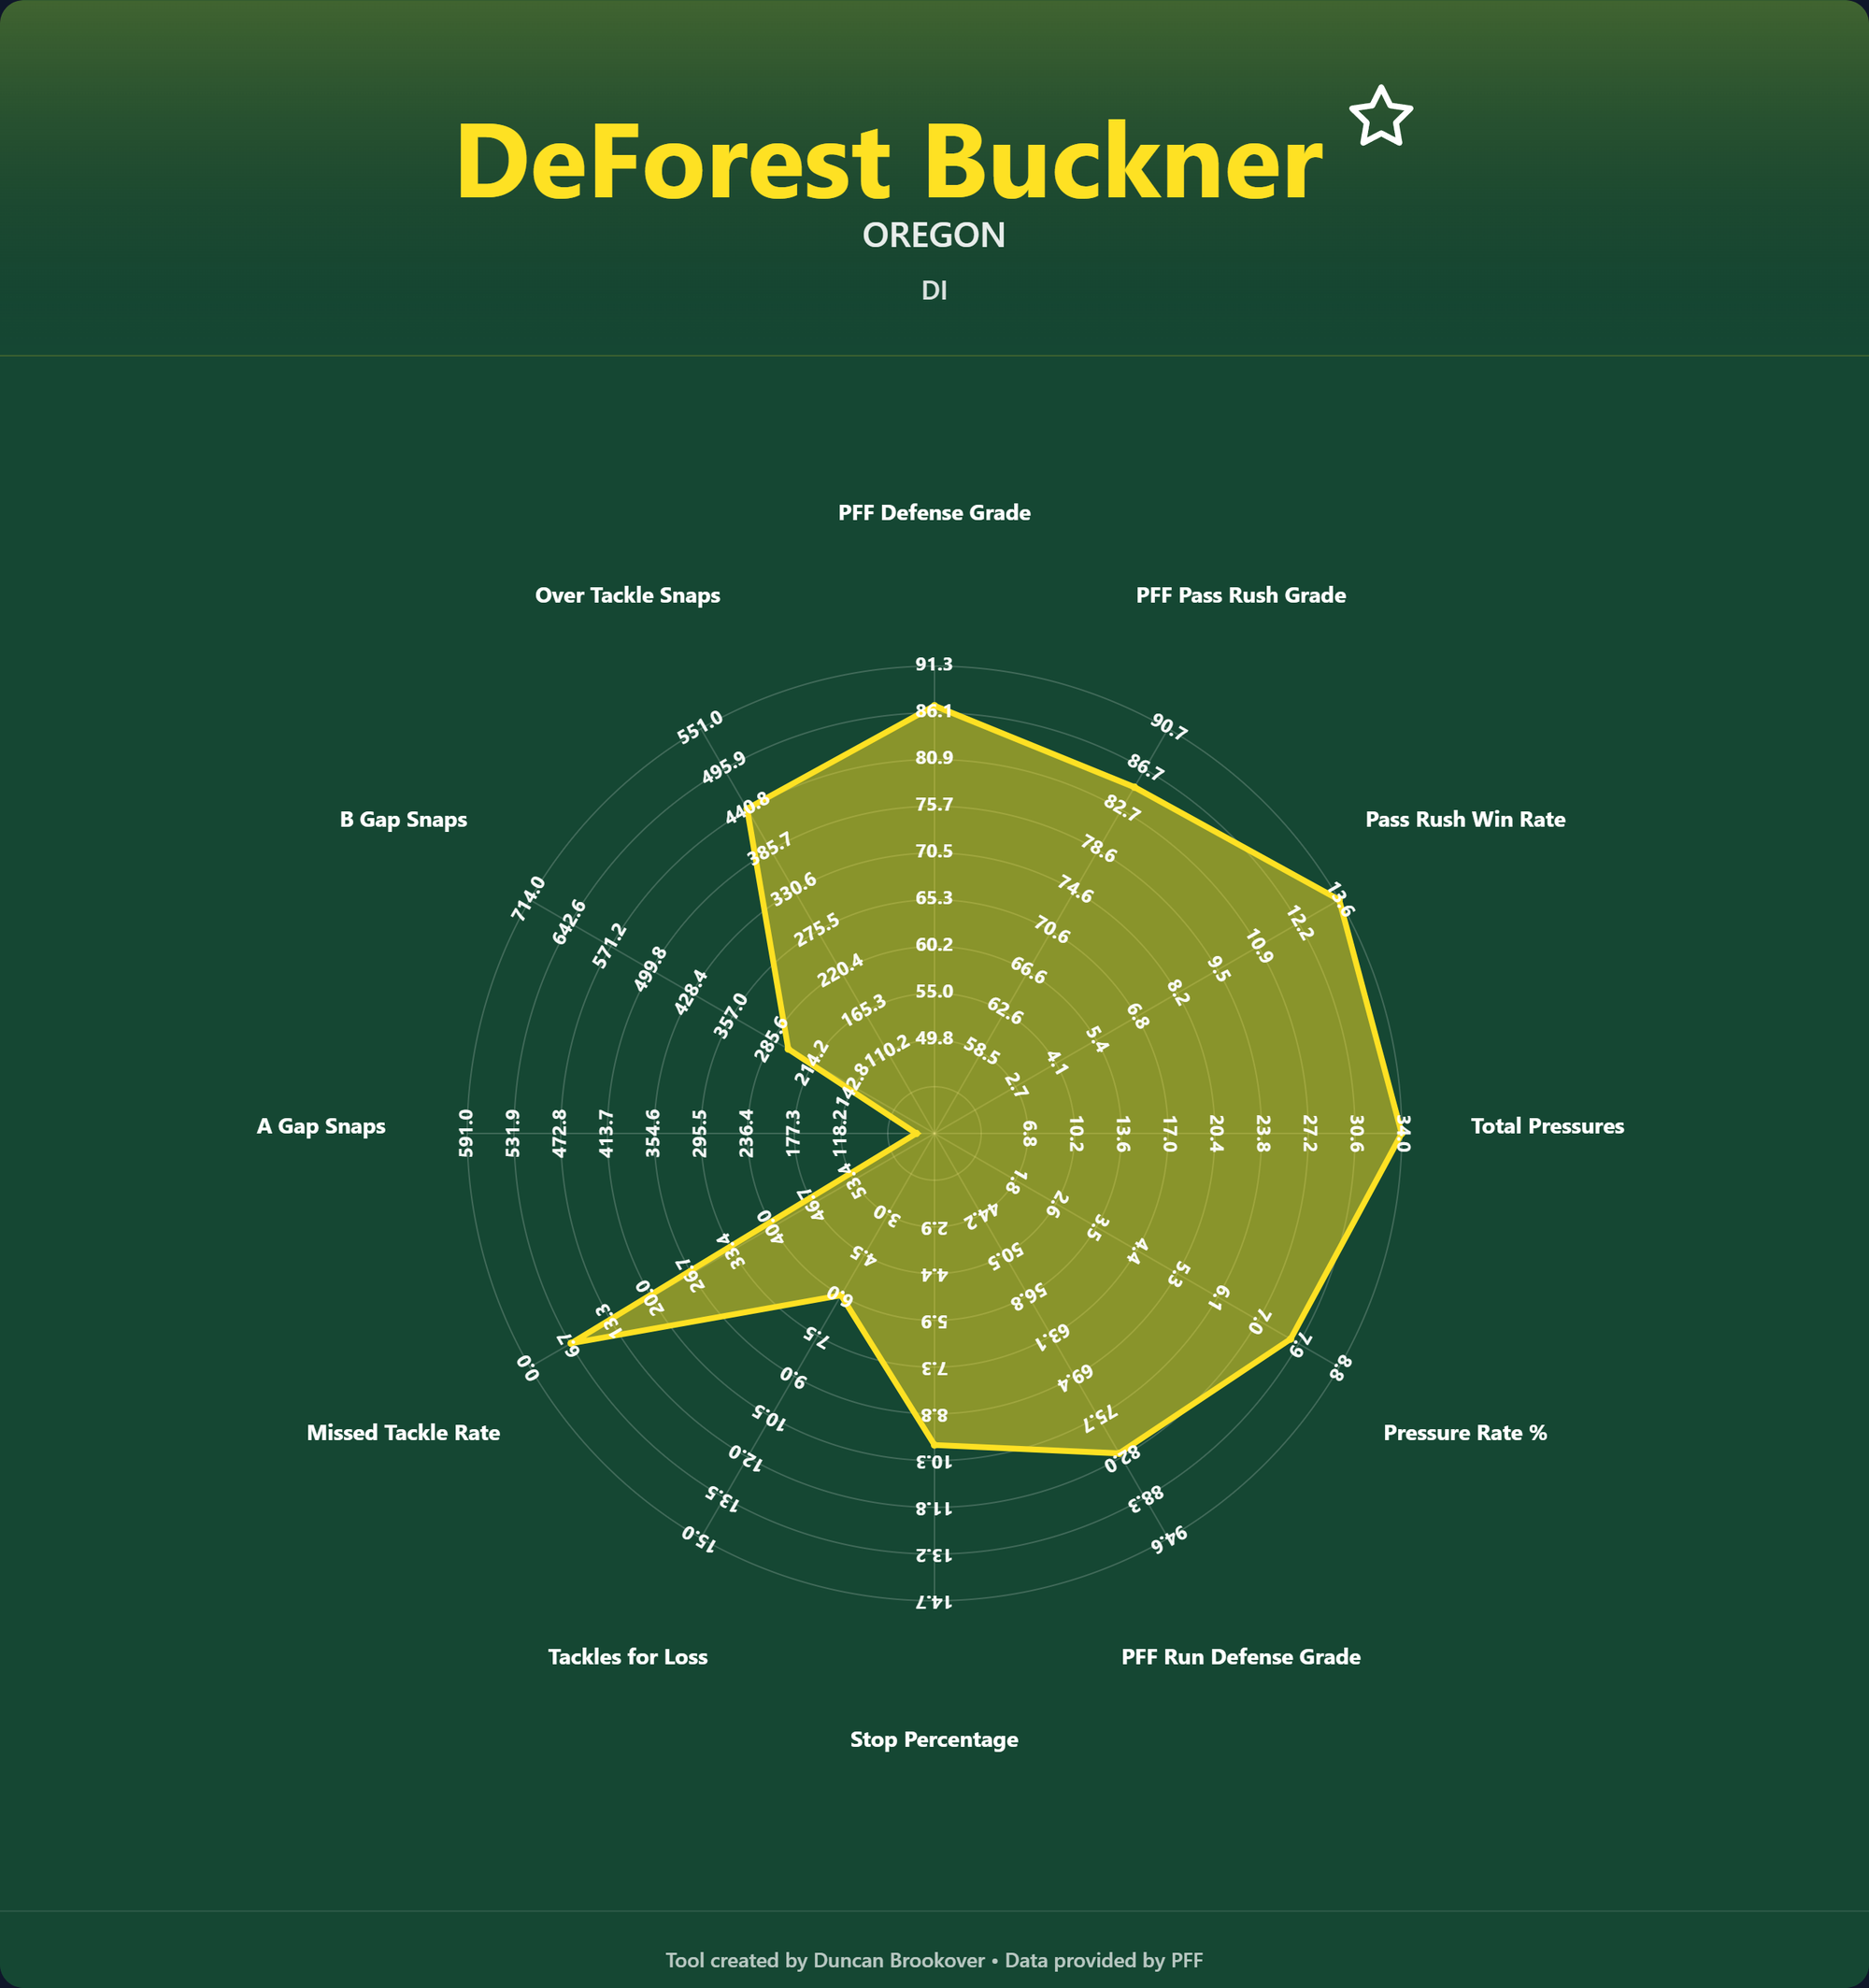
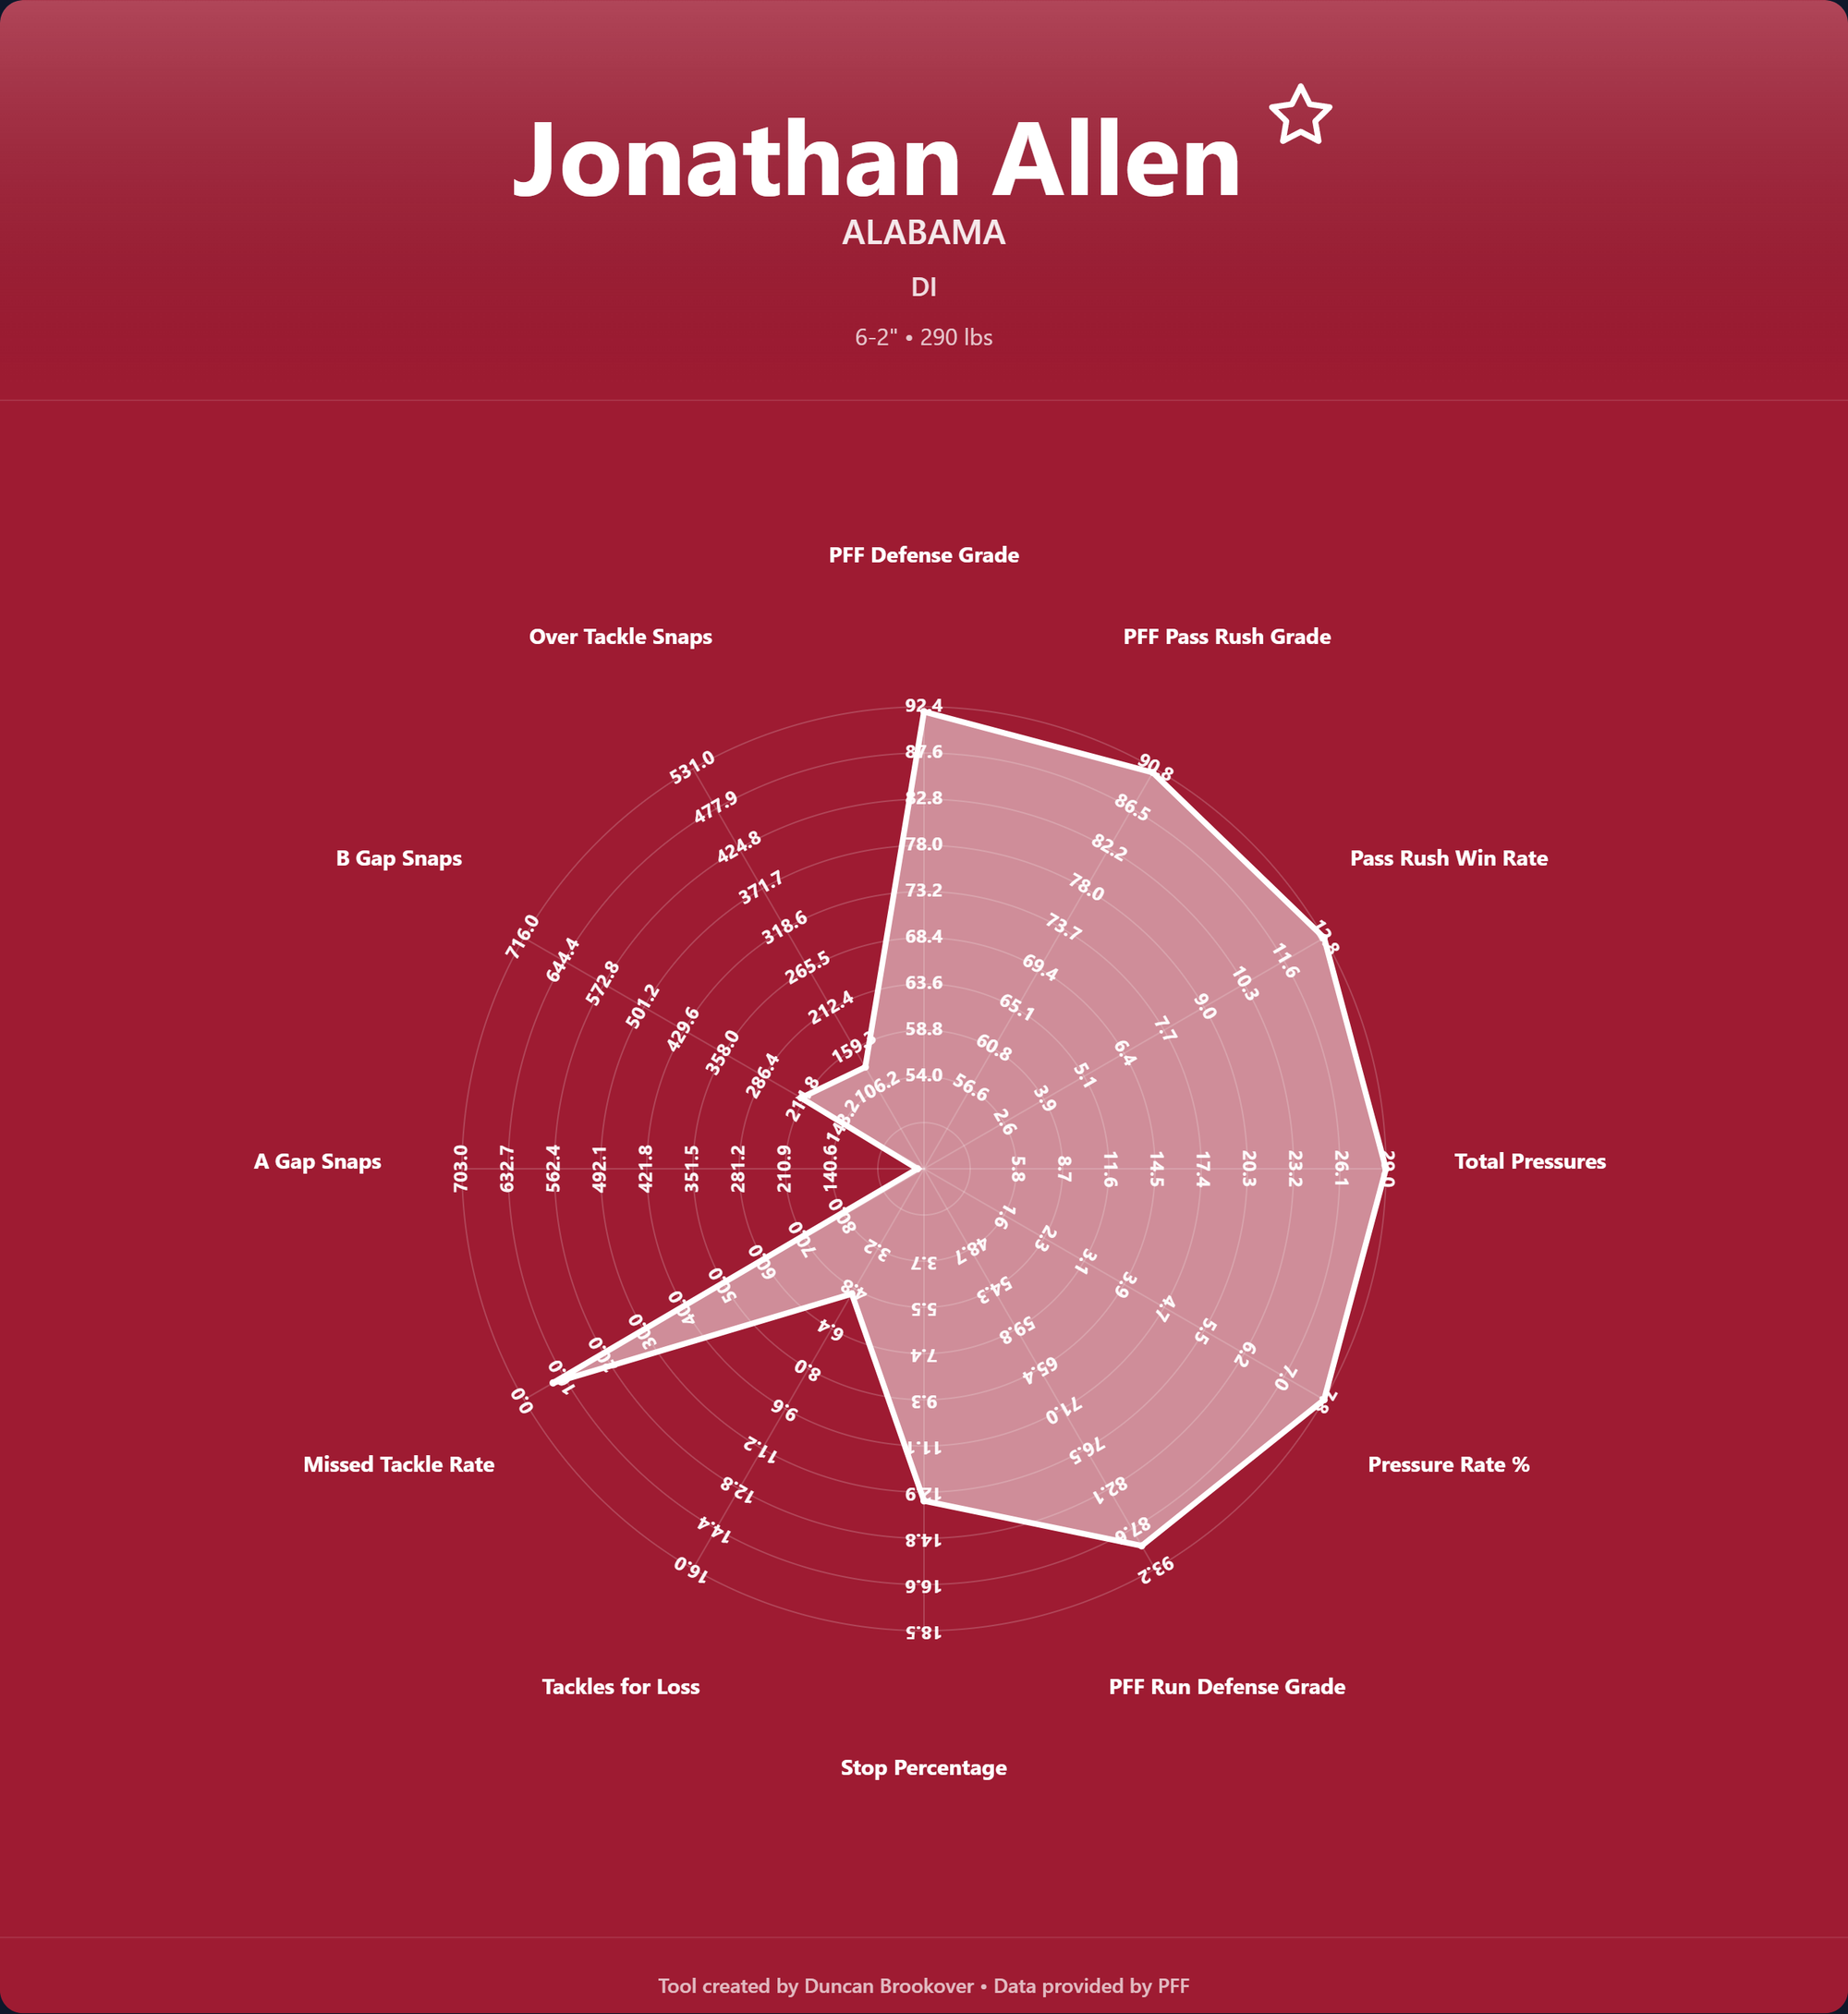
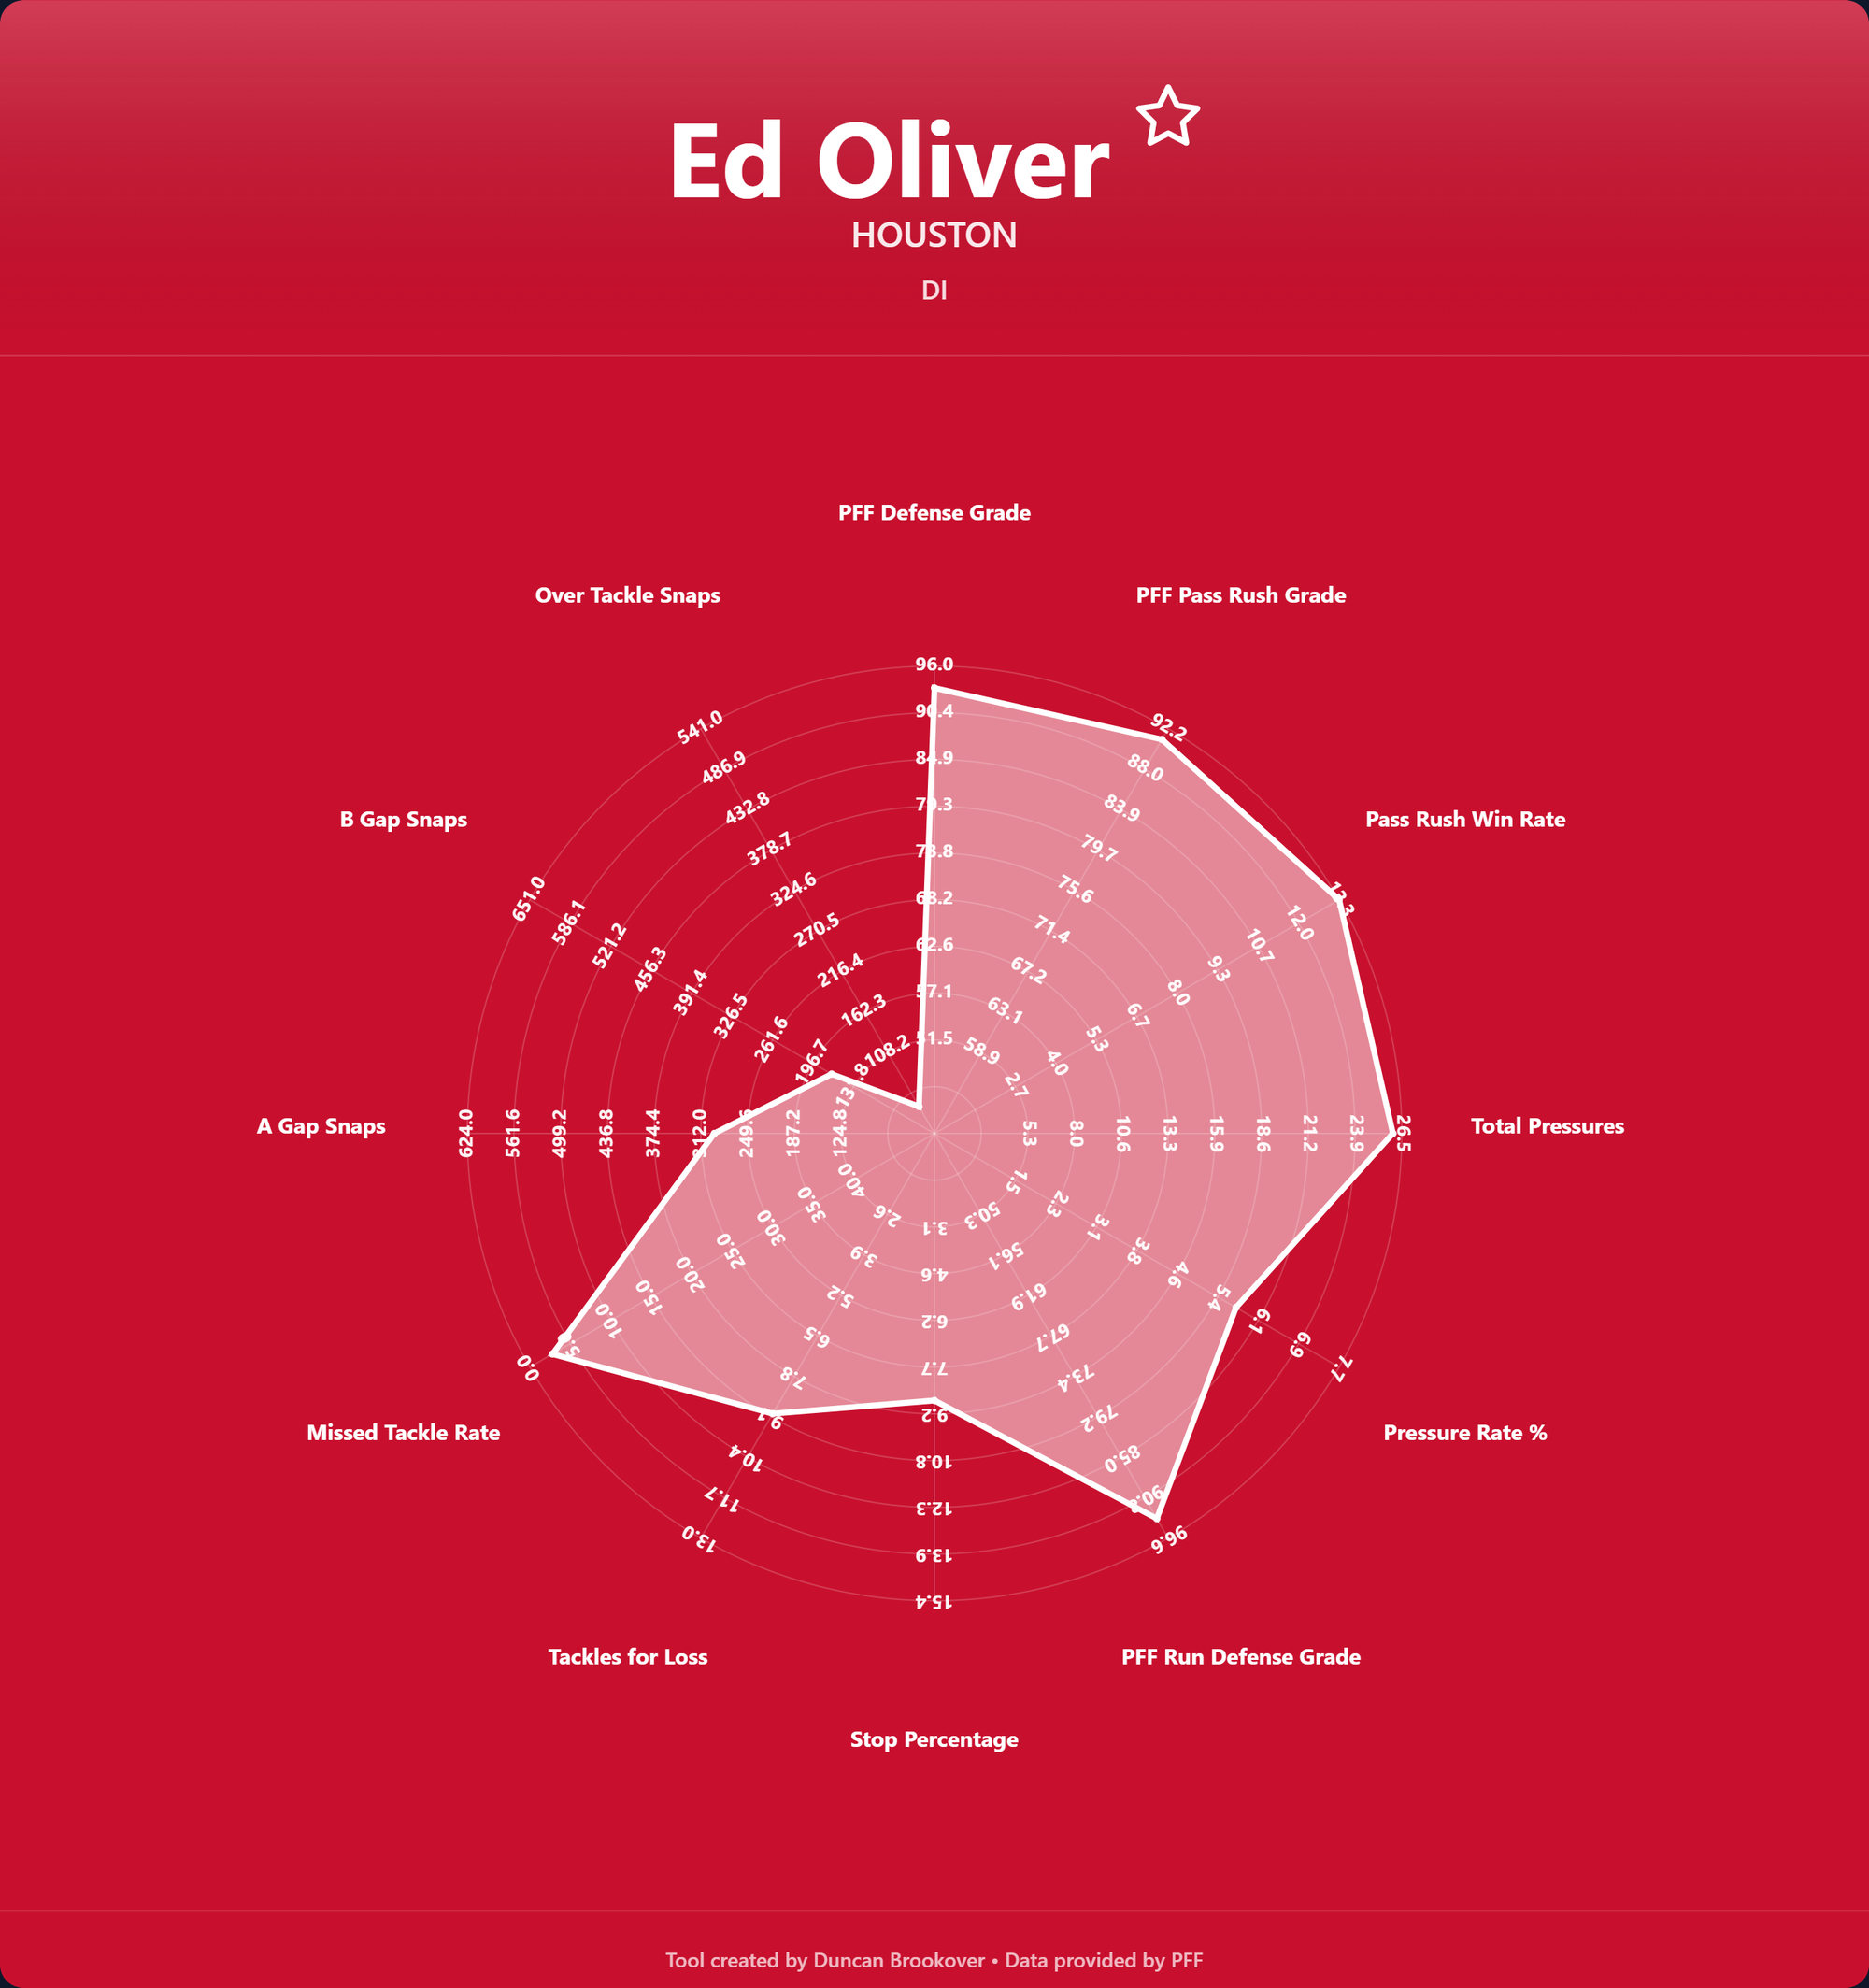
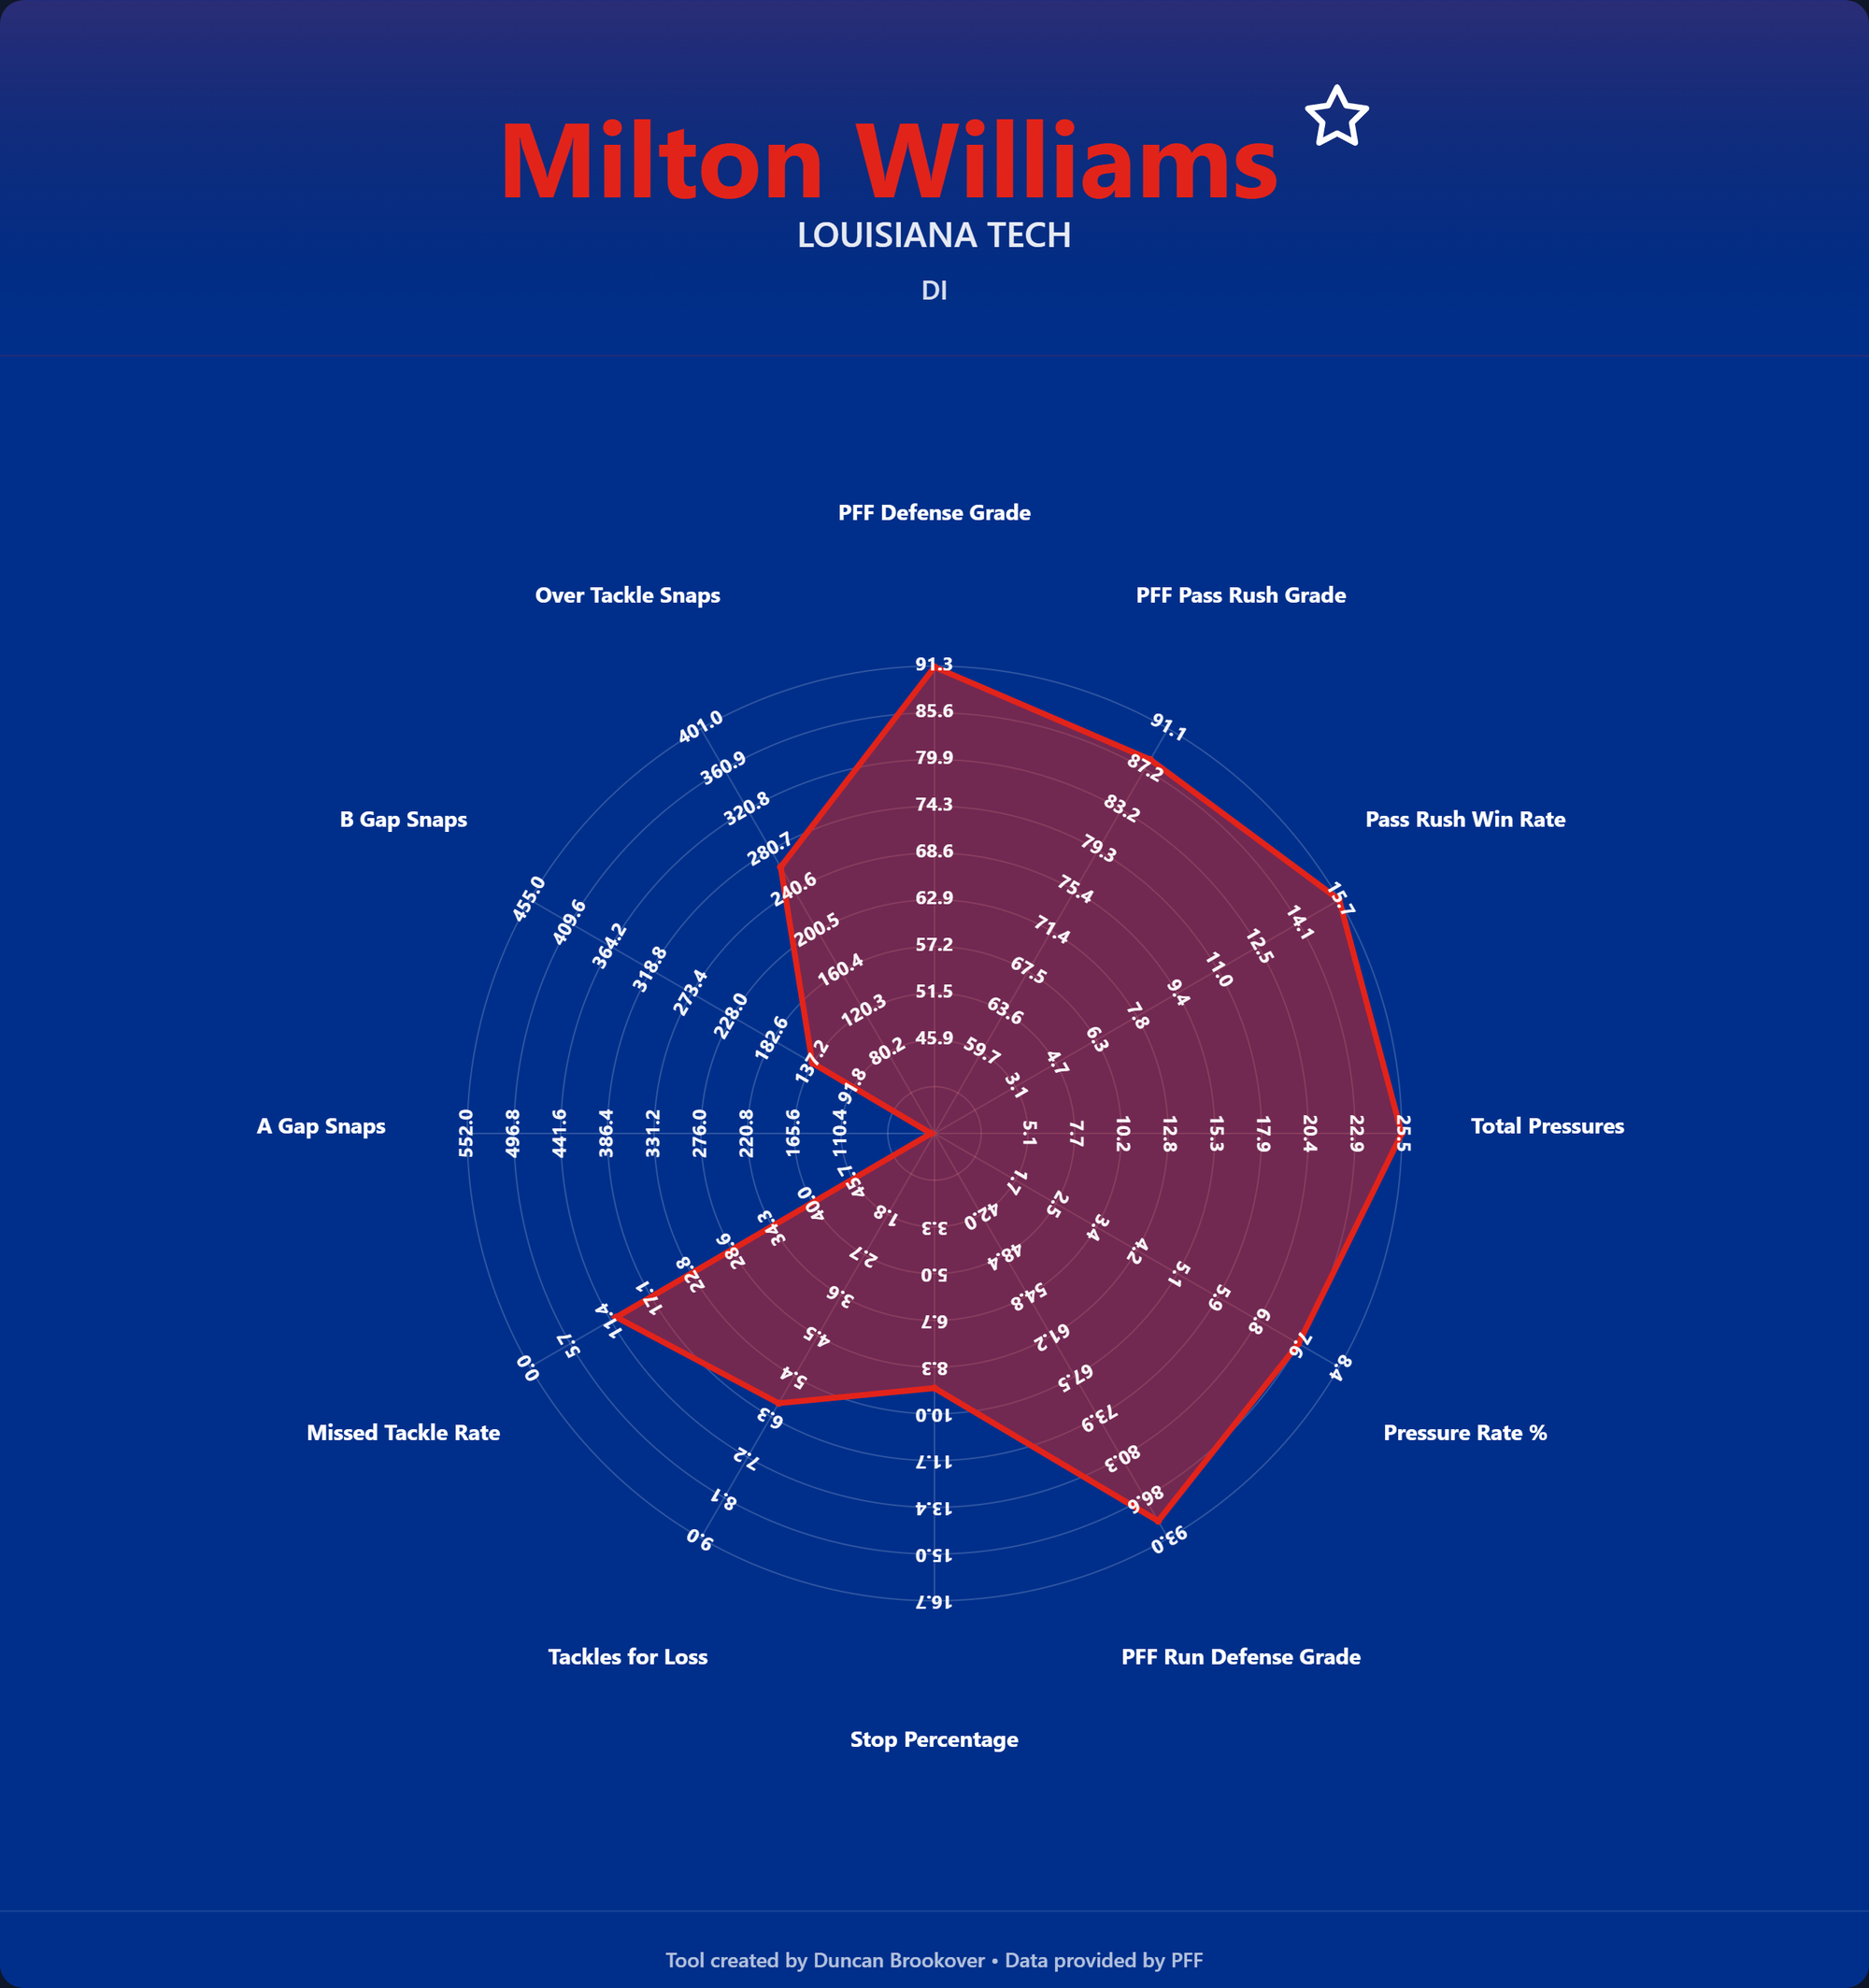
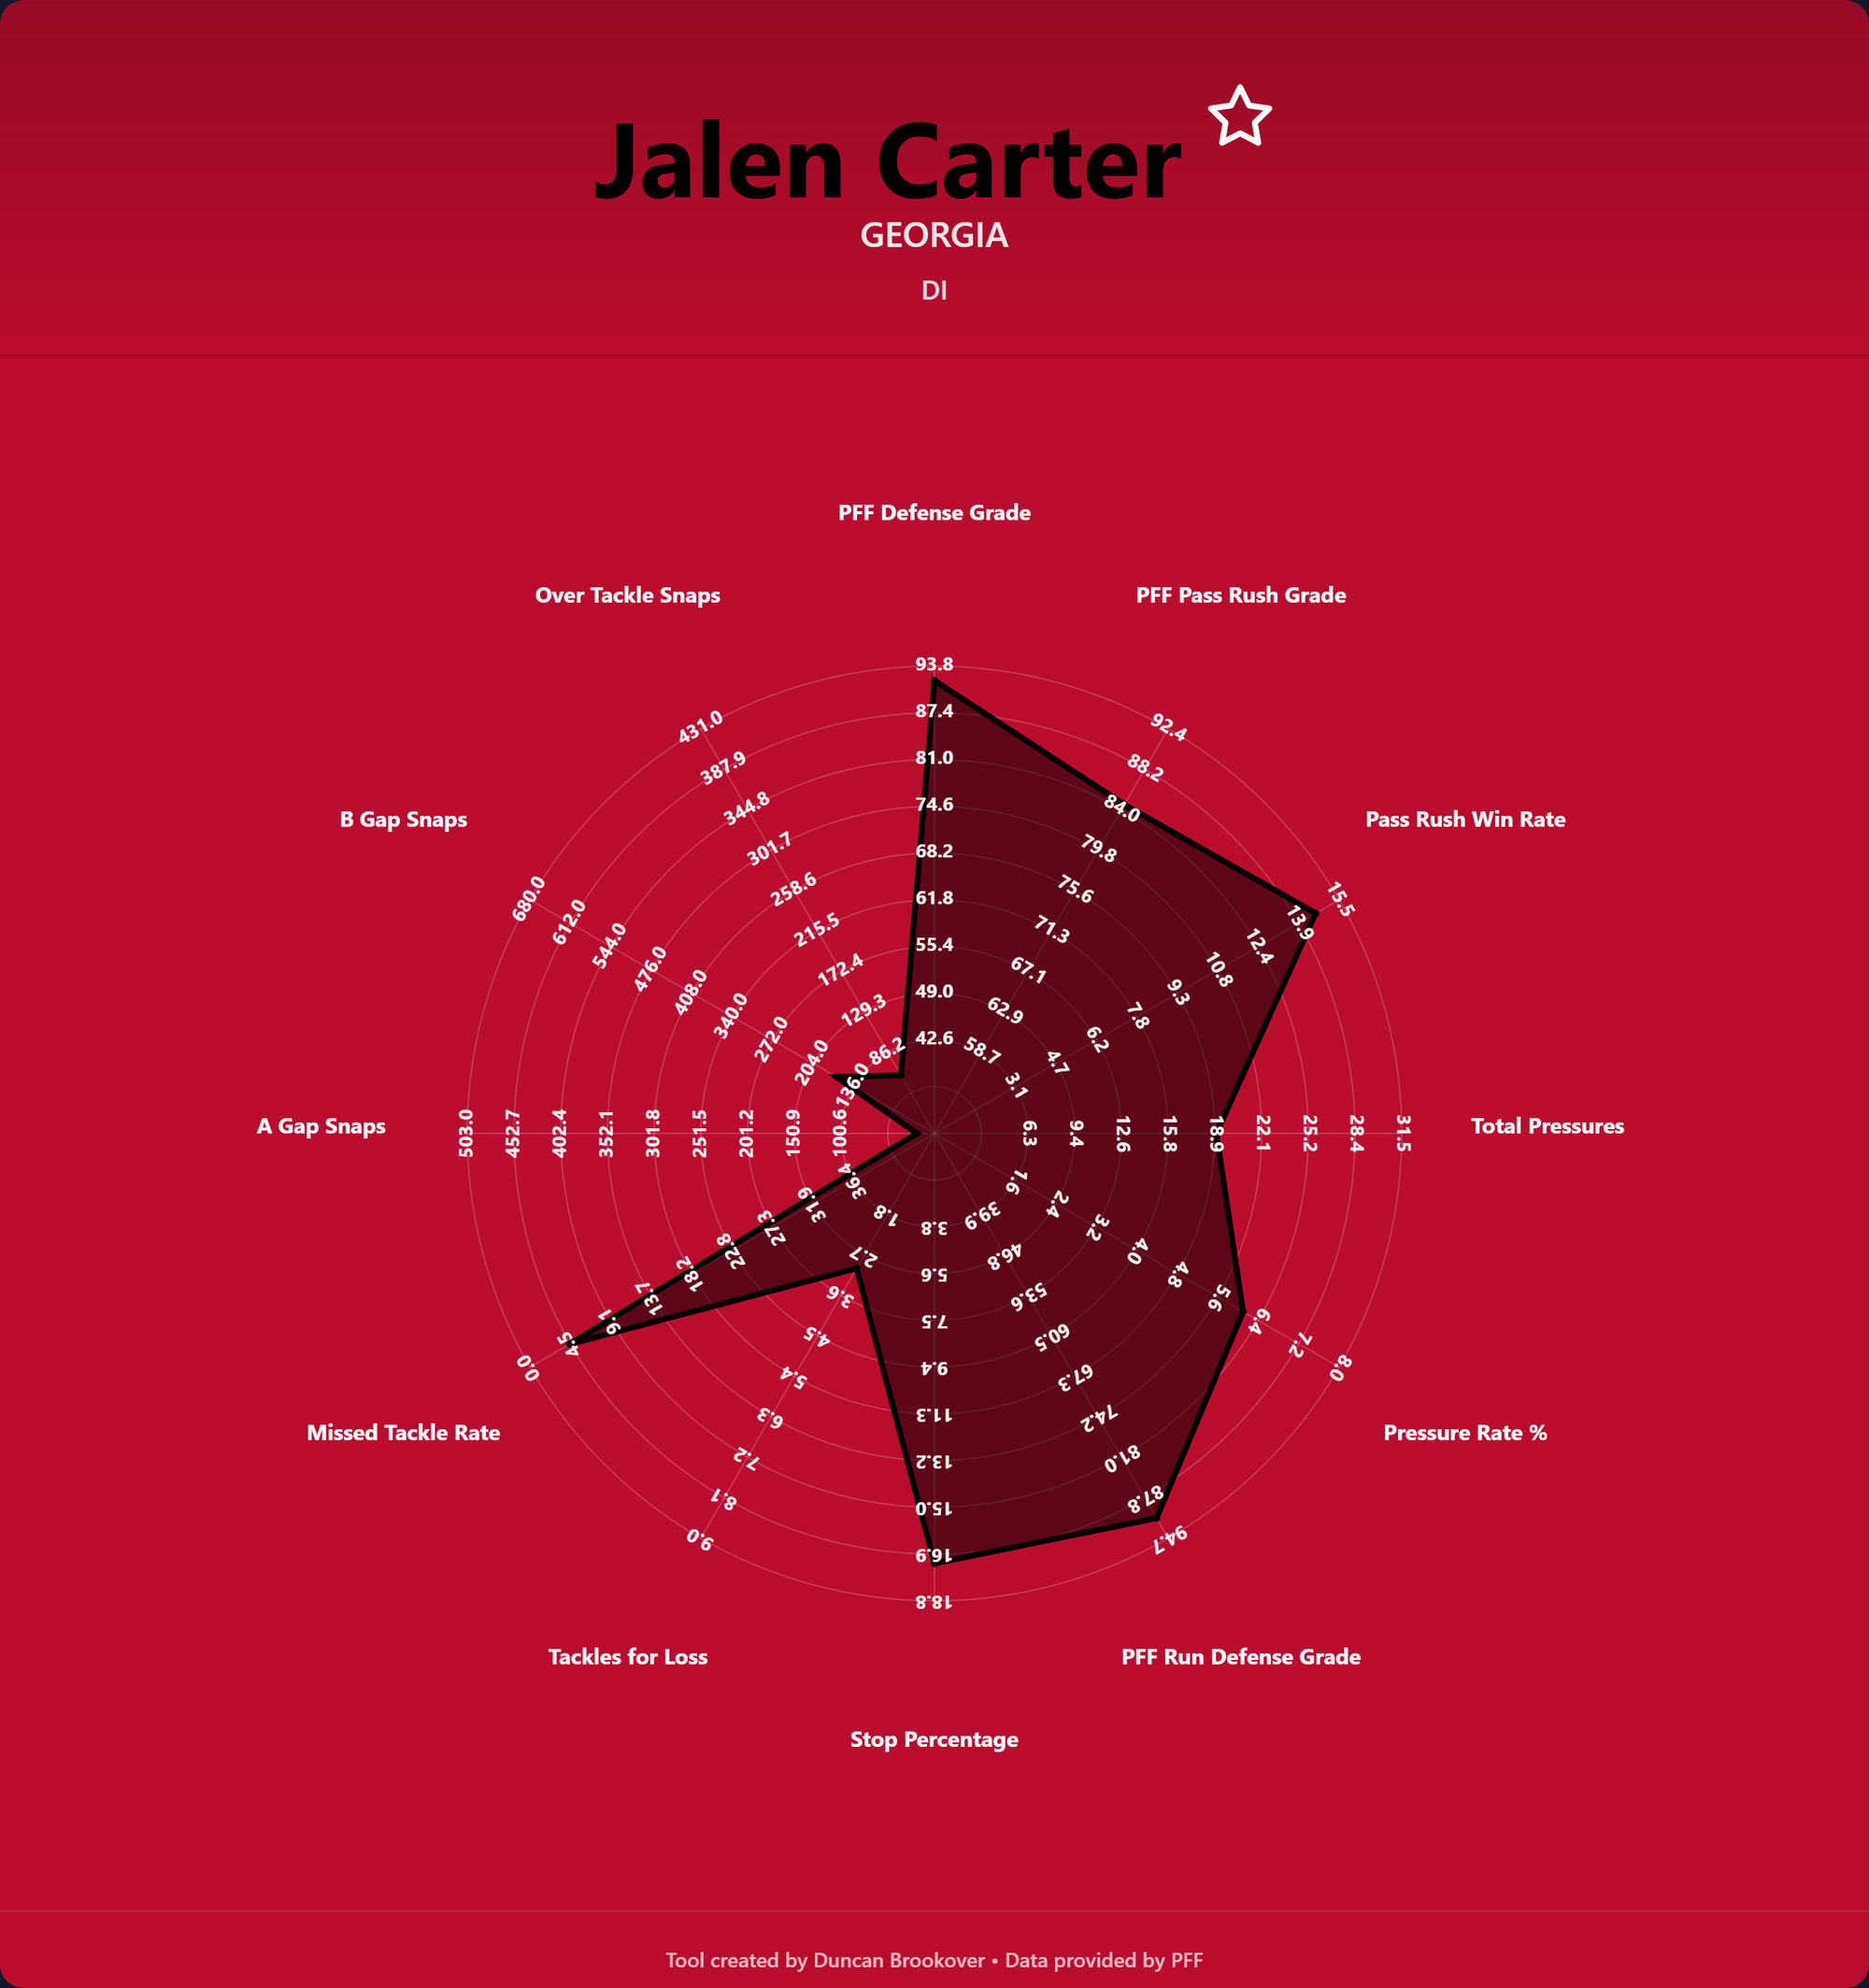
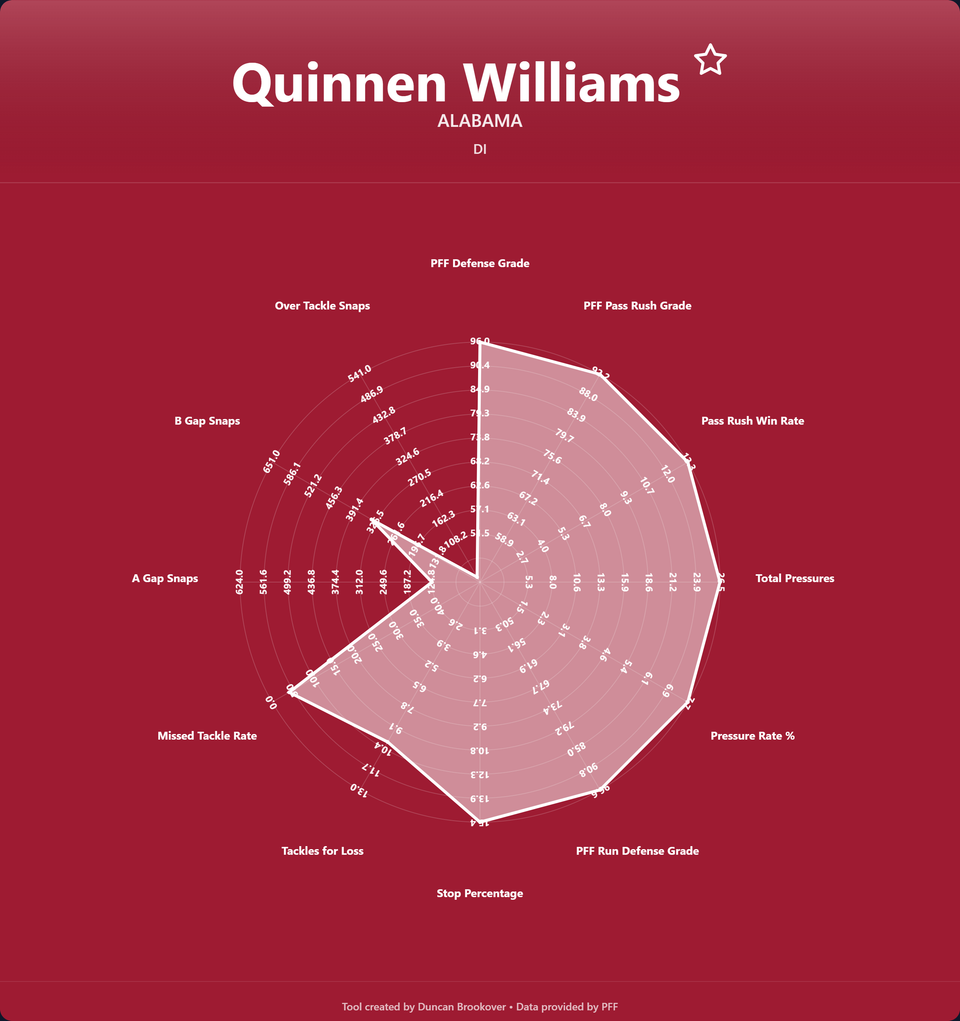
Now some example charts!